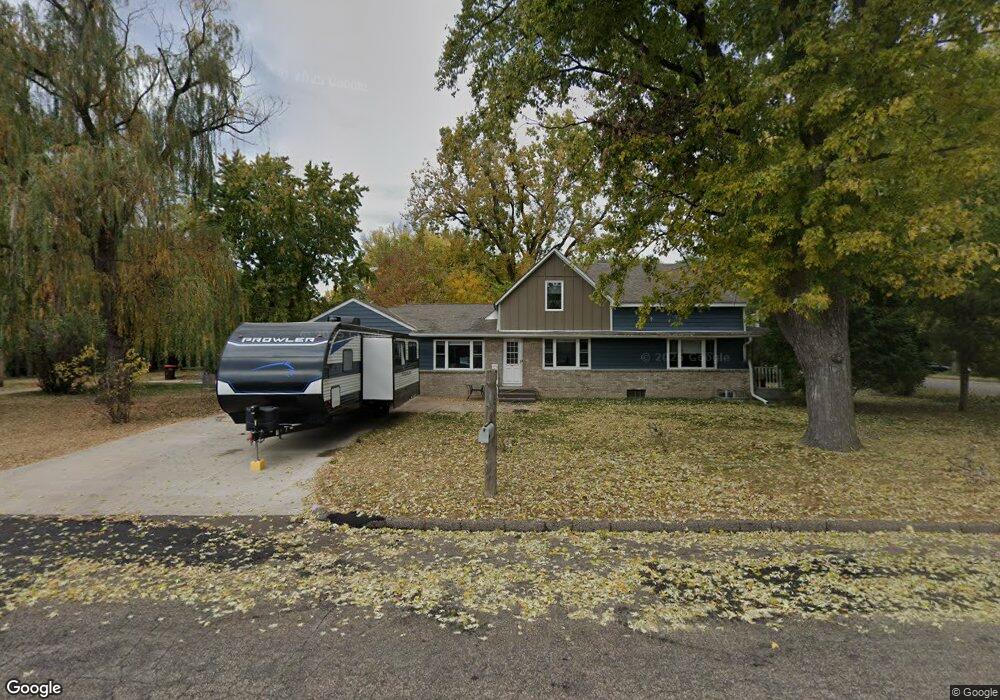
851 851 1st St St. Paul Park, MN 55071
Estimated Value: $304,000 - $351,524
3
Beds
3
Baths
1,773
Sq Ft
$182/Sq Ft
Est. Value
About This Home
This home is located at 851 851 1st St, St. Paul Park, MN 55071 and is currently estimated at $323,131, approximately $182 per square foot. 851 851 1st St is a home located in Washington County with nearby schools including Pullman Elementary School, Oltman Middle School, and Park Senior High School.
Ownership History
Date
Name
Owned For
Owner Type
Purchase Details
Closed on
Sep 17, 2021
Sold by
Winter Justin and Winter Danielle Louise
Bought by
Winter Justin and Winter Danielle Louise
Current Estimated Value
Home Financials for this Owner
Home Financials are based on the most recent Mortgage that was taken out on this home.
Original Mortgage
$227,200
Outstanding Balance
$206,735
Interest Rate
2.8%
Mortgage Type
New Conventional
Estimated Equity
$116,396
Purchase Details
Closed on
Mar 7, 2013
Sold by
Yang Nancy
Bought by
Winter Justin
Home Financials for this Owner
Home Financials are based on the most recent Mortgage that was taken out on this home.
Original Mortgage
$127,546
Interest Rate
3.87%
Mortgage Type
FHA
Purchase Details
Closed on
Nov 14, 2001
Sold by
Brashier Michael D
Bought by
Her Chy Keo
Purchase Details
Closed on
Apr 27, 1999
Sold by
Morehouse Dean C and Morehouse Kathleen Ann
Bought by
Brashier Michael D
Create a Home Valuation Report for This Property
The Home Valuation Report is an in-depth analysis detailing your home's value as well as a comparison with similar homes in the area
Home Values in the Area
Average Home Value in this Area
Purchase History
| Date | Buyer | Sale Price | Title Company |
|---|---|---|---|
| Winter Justin | -- | Affinity Plus Title Company | |
| Winter Justin | $129,900 | Title Recording Svcs | |
| Her Chy Keo | $206,200 | -- | |
| Brashier Michael D | $120,000 | -- |
Source: Public Records
Mortgage History
| Date | Status | Borrower | Loan Amount |
|---|---|---|---|
| Open | Winter Justin | $227,200 | |
| Closed | Winter Justin | $127,546 |
Source: Public Records
Tax History Compared to Growth
Tax History
| Year | Tax Paid | Tax Assessment Tax Assessment Total Assessment is a certain percentage of the fair market value that is determined by local assessors to be the total taxable value of land and additions on the property. | Land | Improvement |
|---|---|---|---|---|
| 2024 | $4,198 | $327,700 | $72,000 | $255,700 |
| 2023 | $4,198 | $302,700 | $72,000 | $230,700 |
| 2022 | $3,226 | $288,000 | $71,500 | $216,500 |
| 2021 | $3,080 | $239,800 | $59,500 | $180,300 |
| 2020 | $3,244 | $233,500 | $59,500 | $174,000 |
| 2019 | $3,144 | $241,500 | $67,000 | $174,500 |
| 2018 | $2,606 | $222,000 | $59,000 | $163,000 |
| 2017 | $2,418 | $187,500 | $55,000 | $132,500 |
| 2016 | $2,348 | $179,400 | $52,000 | $127,400 |
| 2015 | $2,182 | $151,900 | $48,200 | $103,700 |
| 2013 | -- | $122,900 | $38,000 | $84,900 |
Source: Public Records
Map
Nearby Homes
- 11XX 1st St
- 1142 1st St
- 1121 5th St
- TBD Broadway Ave
- 801 Summit Ave
- 1227 5th St
- 1033 Portland Ave
- 1200 Summit Ave
- 1410 5th St
- 6969 River Rd
- 7023 Concord Blvd
- 7344 Degrio Way
- 4049 75th St E
- 1020 Gary Dr
- 1571 Summit Ave
- 7394 Dawn Ave
- 6444 Genevieve Trail
- 3944 76th Way E
- 1601 14th Ave
- 6538 Genevieve Trail