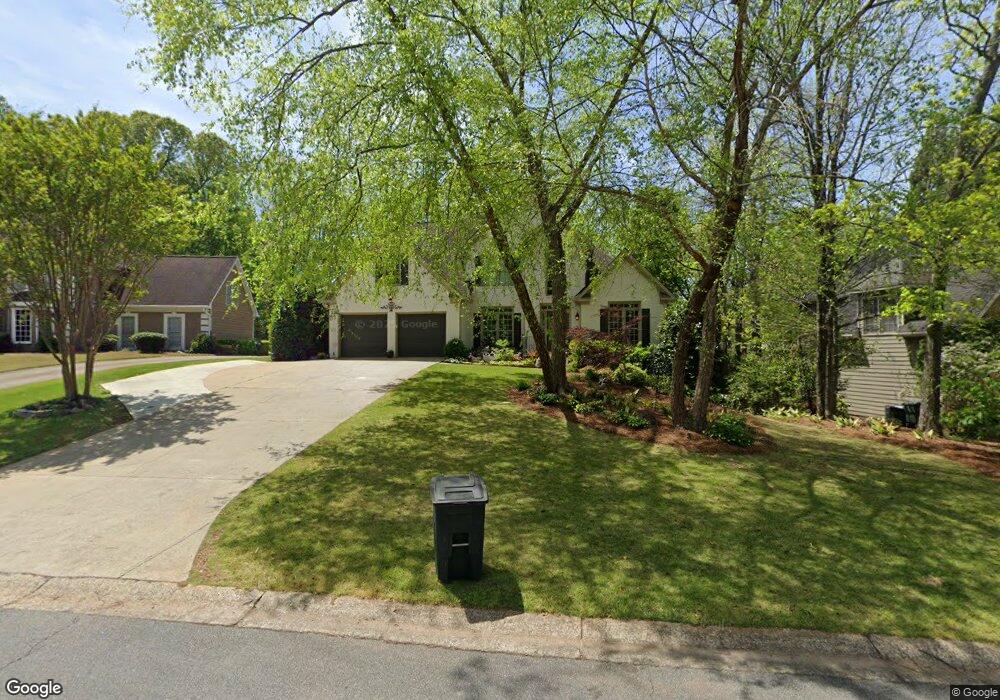
851 Devonwood Trail NW Marietta, GA 30064
Estimated Value: $638,850 - $736,000
4
Beds
4
Baths
3,008
Sq Ft
$225/Sq Ft
Est. Value
About This Home
This home is located at 851 Devonwood Trail NW, Marietta, GA 30064 and is currently estimated at $675,963, approximately $224 per square foot. 851 Devonwood Trail NW is a home located in Cobb County with nearby schools including A.L. Burruss Elementary School, Marietta Sixth Grade Academy, and Marietta Middle School.
Ownership History
Date
Name
Owned For
Owner Type
Purchase Details
Closed on
Sep 22, 2017
Sold by
Bragg Jeffrey T
Bought by
Herrero Robert A and Herrero Kelly N
Current Estimated Value
Home Financials for this Owner
Home Financials are based on the most recent Mortgage that was taken out on this home.
Original Mortgage
$305,600
Outstanding Balance
$254,923
Interest Rate
3.86%
Mortgage Type
New Conventional
Estimated Equity
$421,040
Purchase Details
Closed on
Sep 21, 2015
Sold by
Mitchell David B
Bought by
Bragg Jeffrey T and Ramirez Angela P Vela
Home Financials for this Owner
Home Financials are based on the most recent Mortgage that was taken out on this home.
Original Mortgage
$288,000
Interest Rate
3.97%
Mortgage Type
New Conventional
Purchase Details
Closed on
Nov 11, 1993
Sold by
Centex Real Est Corp
Bought by
Mitchell David B Cardelia
Create a Home Valuation Report for This Property
The Home Valuation Report is an in-depth analysis detailing your home's value as well as a comparison with similar homes in the area
Home Values in the Area
Average Home Value in this Area
Purchase History
| Date | Buyer | Sale Price | Title Company |
|---|---|---|---|
| Herrero Robert A | $382,000 | -- | |
| Bragg Jeffrey T | $320,000 | -- | |
| Mitchell David B Cardelia | $189,200 | -- |
Source: Public Records
Mortgage History
| Date | Status | Borrower | Loan Amount |
|---|---|---|---|
| Open | Herrero Robert A | $305,600 | |
| Previous Owner | Bragg Jeffrey T | $288,000 |
Source: Public Records
Tax History Compared to Growth
Tax History
| Year | Tax Paid | Tax Assessment Tax Assessment Total Assessment is a certain percentage of the fair market value that is determined by local assessors to be the total taxable value of land and additions on the property. | Land | Improvement |
|---|---|---|---|---|
| 2024 | $1,065 | $248,364 | $52,000 | $196,364 |
| 2023 | $913 | $216,748 | $44,000 | $172,748 |
| 2022 | $1,065 | $165,072 | $24,000 | $141,072 |
| 2021 | $1,086 | $165,072 | $24,000 | $141,072 |
| 2020 | $1,085 | $152,712 | $24,000 | $128,712 |
| 2019 | $1,085 | $152,712 | $24,000 | $128,712 |
| 2018 | $1,083 | $135,876 | $24,000 | $111,876 |
| 2017 | $781 | $135,876 | $24,000 | $111,876 |
| 2016 | $780 | $122,920 | $24,000 | $98,920 |
| 2015 | $624 | $122,920 | $24,000 | $98,920 |
| 2014 | $634 | $102,896 | $0 | $0 |
Source: Public Records
Map
Nearby Homes
- 913 Chesterfield Place NW
- 927 Burnt Hickory Cir NW Unit 10
- 1161 Grand Oaks Glen NW
- 1156 Grand Oaks Glen NW
- 1032 Chippendale Trail SW
- 1119 Pilgrim Way SW
- 306 Anders Pth NW
- 314 Anders Path
- 960 Wemberley Ln
- 1141 Whitlock Ave NW
- 181 Brighton Ct SW
- 917 Wemberley Ln
- 002 Wakehurst Way
- 204 Wakehurst Way
- 201 Wakehurst Way
- The Vinings Plan at The Cottages at Keeler Woods
- The Weston Plan at The Cottages at Keeler Woods
- 980 Wemberley Ln
- 909 Wemberley Ln
- 920 Wemberley Ln
- 861 Devonwood Trail NW
- 841 Devonwood Trail NW Unit IV
- 893 Chesterfield Place NW Unit 4
- 0 Devonwood Trail NW Unit 3174483
- 0 Devonwood Trail NW Unit 8747962
- 0 Devonwood Trail NW Unit 8570566
- 0 Devonwood Trail NW Unit 8410108
- 0 Devonwood Trail NW Unit 8299331
- 0 Devonwood Trail NW Unit 8230684
- 0 Devonwood Trail NW Unit 8961956
- 0 Devonwood Trail NW
- 881 Devonwood Trail NW
- 894 Chesterfield Place NW Unit IV
- 903 Chesterfield Place NW
- 842 Devonwood Trail NW
- 852 Devonwood Trail NW
- 835 Devonwood Trail NW
- 862 Devonwood Trail NW
- 891 Devonwood Trail NW
- 891 Devonwood Trail NW Unit 175