Estimated Value: $269,000 - $998,665
2
Beds
1
Bath
1,296
Sq Ft
$541/Sq Ft
Est. Value
About This Home
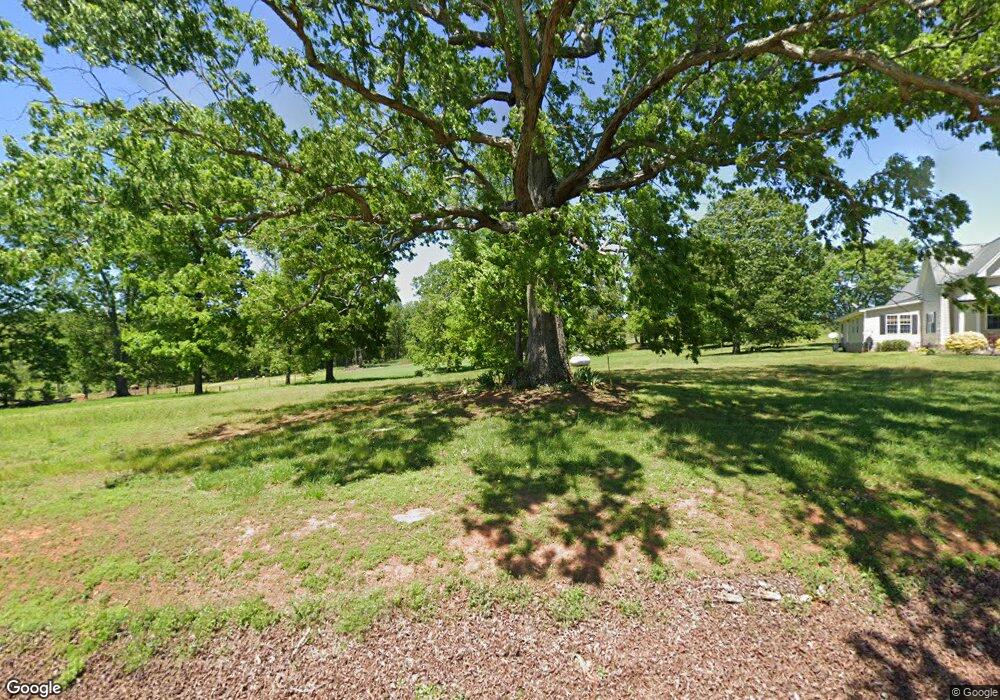
This home is located at 851 Payne Rd, Homer, GA 30547 and is currently estimated at $700,666, approximately $540 per square foot. 851 Payne Rd is a home located in Banks County with nearby schools including Banks County Primary School, Banks County Elementary School, and Banks County Middle School.
Ownership History
Date
Name
Owned For
Owner Type
Purchase Details
Closed on
Feb 7, 2024
Sold by
Finley Brenda K
Bought by
Finley Amanda Marie and Finley Luther T
Current Estimated Value
Purchase Details
Closed on
Jun 25, 2019
Sold by
Lawson Stanley R
Bought by
Finley James S and Finley Brenda K
Home Financials for this Owner
Home Financials are based on the most recent Mortgage that was taken out on this home.
Original Mortgage
$464,331
Interest Rate
3.9%
Mortgage Type
Commercial
Purchase Details
Closed on
Jun 1, 2015
Sold by
Aggeorgia Farm Cr
Bought by
Lawson Stanley R and Lawson Julia D
Home Financials for this Owner
Home Financials are based on the most recent Mortgage that was taken out on this home.
Original Mortgage
$235,000
Interest Rate
3.79%
Mortgage Type
New Conventional
Create a Home Valuation Report for This Property
The Home Valuation Report is an in-depth analysis detailing your home's value as well as a comparison with similar homes in the area
Home Values in the Area
Average Home Value in this Area
Purchase History
| Date | Buyer | Sale Price | Title Company |
|---|---|---|---|
| Finley Amanda Marie | $130,000 | -- | |
| Finley James S | $450,000 | -- | |
| Lawson Stanley R | $241,500 | -- |
Source: Public Records
Mortgage History
| Date | Status | Borrower | Loan Amount |
|---|---|---|---|
| Previous Owner | Finley James S | $464,331 | |
| Previous Owner | Lawson Stanley R | $235,000 |
Source: Public Records
Tax History Compared to Growth
Tax History
| Year | Tax Paid | Tax Assessment Tax Assessment Total Assessment is a certain percentage of the fair market value that is determined by local assessors to be the total taxable value of land and additions on the property. | Land | Improvement |
|---|---|---|---|---|
| 2025 | $1,941 | $174,513 | $91,184 | $83,329 |
| 2024 | $1,941 | $297,705 | $222,246 | $75,459 |
| 2023 | $2,152 | $270,768 | $226,968 | $43,800 |
| 2022 | $1,521 | $221,991 | $182,103 | $39,888 |
| 2021 | $1,559 | $189,954 | $151,754 | $38,200 |
| 2020 | $1,588 | $183,392 | $144,090 | $39,302 |
| 2019 | $1,592 | $183,392 | $144,090 | $39,302 |
| 2018 | $1,767 | $190,574 | $144,090 | $46,484 |
| 2017 | $1,676 | $165,775 | $125,294 | $40,481 |
| 2016 | $1,608 | $161,947 | $125,294 | $36,653 |
| 2015 | $1,613 | $170,697 | $125,976 | $44,721 |
| 2014 | $1,613 | $237,845 | $193,124 | $44,721 |
| 2013 | -- | $237,845 | $193,124 | $44,721 |
Source: Public Records
Map
Nearby Homes
- 855 Payne Rd
- 1043 Payne Rd
- 1036 Payne Rd
- 1046 Payne Rd
- 1145 Payne Rd
- 420 Payne Rd
- 798 Payne Rd
- 257 Old Keesee Rd
- 541 Damascus Rd
- 639 Damascus Rd
- 106 Old Federal Hwy
- 1173 Payne Rd
- 601 Damascus Rd
- 199 Old Keesee Rd
- 1183 Payne Rd
- 161 Old Keesee Rd
- 621 Damascus Rd
- 515 Damascus Rd
- 455 Damascus Rd
- 499 Damascus Rd