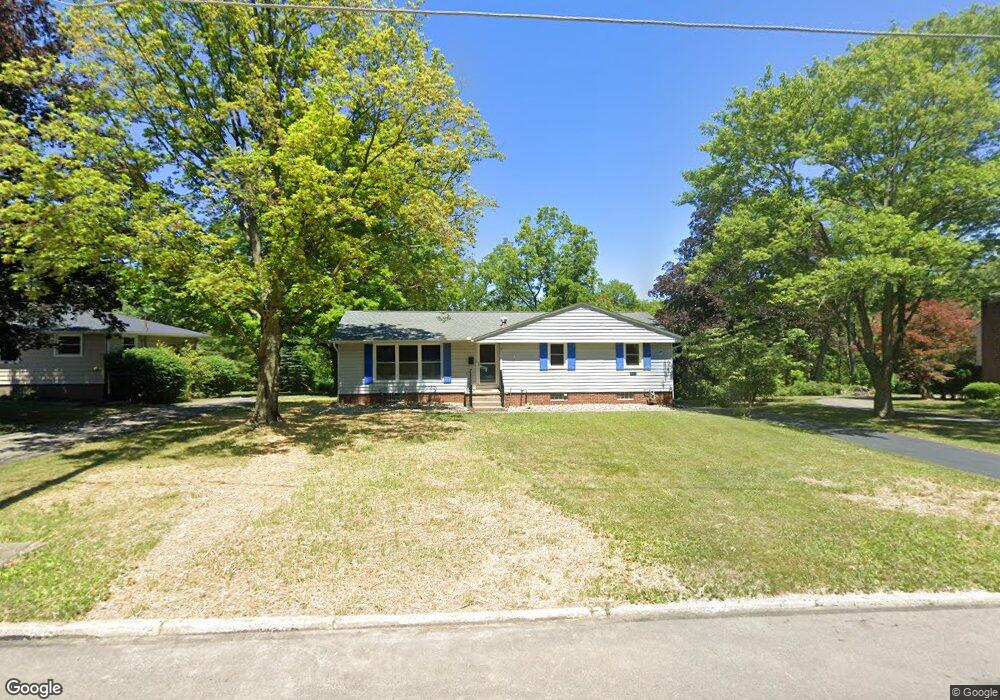
851 Ridge Rd Ashland, OH 44805
Estimated Value: $249,000 - $264,588
3
Beds
2
Baths
1,452
Sq Ft
$176/Sq Ft
Est. Value
About This Home
This home is located at 851 Ridge Rd, Ashland, OH 44805 and is currently estimated at $255,397, approximately $175 per square foot. 851 Ridge Rd is a home located in Ashland County with nearby schools including Ashland High School, Ashland County Community Academy, and Ashland Christian Elementary School.
Ownership History
Date
Name
Owned For
Owner Type
Purchase Details
Closed on
Apr 25, 2018
Sold by
Agard Andrew J
Bought by
J & D White Dev Co Llc
Current Estimated Value
Purchase Details
Closed on
Mar 9, 2007
Sold by
Allen Jon-Scott A
Bought by
Agard Andrew J
Purchase Details
Closed on
May 19, 2000
Sold by
Spurlock William R
Bought by
Allen Jon-Scott A
Purchase Details
Closed on
Dec 3, 1997
Sold by
Fisher Caroline
Bought by
Spurlock William R
Purchase Details
Closed on
Jan 1, 1990
Bought by
Fisher Caroline
Create a Home Valuation Report for This Property
The Home Valuation Report is an in-depth analysis detailing your home's value as well as a comparison with similar homes in the area
Home Values in the Area
Average Home Value in this Area
Purchase History
| Date | Buyer | Sale Price | Title Company |
|---|---|---|---|
| J & D White Dev Co Llc | $140,000 | Great American Title Agcy | |
| Agard Andrew J | $130,000 | -- | |
| Allen Jon-Scott A | $122,000 | -- | |
| Spurlock William R | $96,000 | -- | |
| Fisher Caroline | -- | -- |
Source: Public Records
Tax History Compared to Growth
Tax History
| Year | Tax Paid | Tax Assessment Tax Assessment Total Assessment is a certain percentage of the fair market value that is determined by local assessors to be the total taxable value of land and additions on the property. | Land | Improvement |
|---|---|---|---|---|
| 2024 | $2,178 | $61,480 | $12,800 | $48,680 |
| 2023 | $2,178 | $61,480 | $12,800 | $48,680 |
| 2022 | $1,993 | $44,560 | $9,280 | $35,280 |
| 2021 | $2,002 | $44,560 | $9,280 | $35,280 |
| 2020 | $1,898 | $44,560 | $9,280 | $35,280 |
| 2019 | $1,786 | $38,790 | $9,220 | $29,570 |
| 2018 | $1,752 | $38,790 | $9,220 | $29,570 |
| 2017 | $1,759 | $38,790 | $9,220 | $29,570 |
| 2016 | $1,670 | $35,260 | $8,380 | $26,880 |
| 2015 | $1,655 | $35,260 | $8,380 | $26,880 |
| 2013 | $1,790 | $37,560 | $9,110 | $28,450 |
Source: Public Records
Map
Nearby Homes