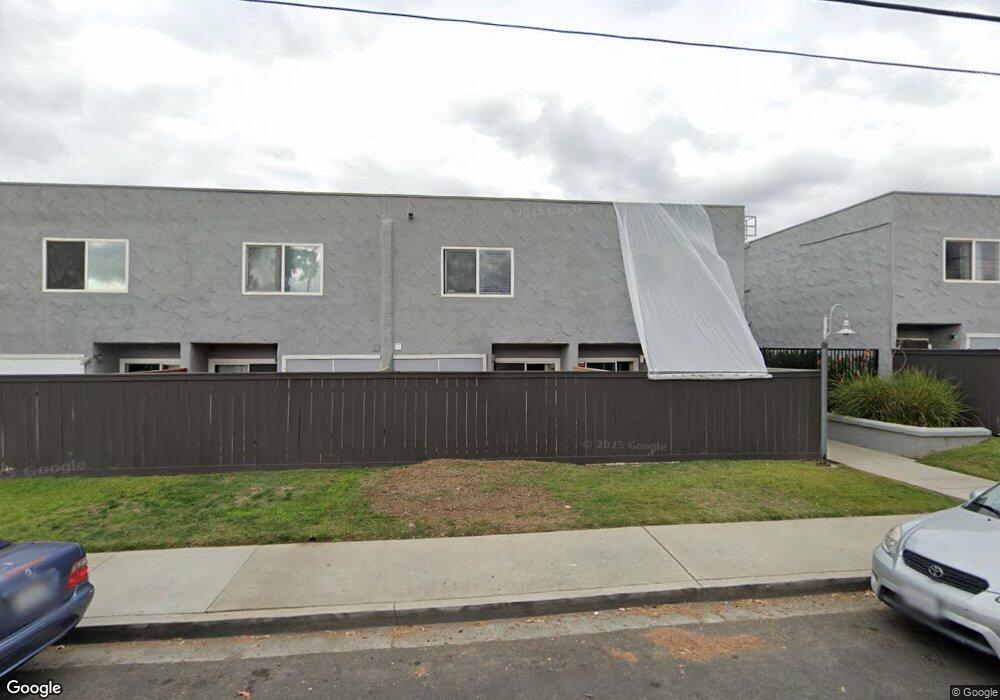
851 S Mollison Ave Unit 16 El Cajon, CA 92020
Estimated Value: $414,000 - $514,000
2
Beds
2
Baths
960
Sq Ft
$464/Sq Ft
Est. Value
About This Home
This home is located at 851 S Mollison Ave Unit 16, El Cajon, CA 92020 and is currently estimated at $444,976, approximately $463 per square foot. 851 S Mollison Ave Unit 16 is a home located in San Diego County with nearby schools including Anza Elementary School, Cajon Valley Middle School, and Bostonia Global High School.
Ownership History
Date
Name
Owned For
Owner Type
Purchase Details
Closed on
Jun 24, 2015
Sold by
Kais George Al
Bought by
Halaby Din
Current Estimated Value
Purchase Details
Closed on
Jun 23, 2015
Sold by
Zaitona Ayad
Bought by
Halaby Dina
Purchase Details
Closed on
Aug 26, 2010
Sold by
Secretary Of Veterans Affairs
Bought by
Zaitona Ayad
Purchase Details
Closed on
Jul 2, 2010
Sold by
Wells Fargo Bank Na
Bought by
The Secretary Of Veterans Affairs
Purchase Details
Closed on
Jul 1, 2010
Sold by
Louviere Anthony Clyde and Louviere Diane
Bought by
Wells Fargo Bank Na
Purchase Details
Closed on
Oct 13, 2006
Sold by
851 Mollison Llc
Bought by
Louviere Anthony Clyde and Louviere Diane
Home Financials for this Owner
Home Financials are based on the most recent Mortgage that was taken out on this home.
Original Mortgage
$269,063
Interest Rate
6.3%
Mortgage Type
VA
Create a Home Valuation Report for This Property
The Home Valuation Report is an in-depth analysis detailing your home's value as well as a comparison with similar homes in the area
Home Values in the Area
Average Home Value in this Area
Purchase History
| Date | Buyer | Sale Price | Title Company |
|---|---|---|---|
| Halaby Din | -- | Lawyers Title Company | |
| Halaby Dina | $208,000 | Lawyers Title Company | |
| Zaitona Ayad | -- | Lawyers Title Company | |
| Zaitona Ayad | $120,000 | None Available | |
| The Secretary Of Veterans Affairs | -- | None Available | |
| Wells Fargo Bank Na | $113,688 | Accommodation | |
| Louviere Anthony Clyde | $263,500 | Chicago Title Co |
Source: Public Records
Mortgage History
| Date | Status | Borrower | Loan Amount |
|---|---|---|---|
| Previous Owner | Louviere Anthony Clyde | $269,063 |
Source: Public Records
Tax History Compared to Growth
Tax History
| Year | Tax Paid | Tax Assessment Tax Assessment Total Assessment is a certain percentage of the fair market value that is determined by local assessors to be the total taxable value of land and additions on the property. | Land | Improvement |
|---|---|---|---|---|
| 2025 | $3,675 | $246,221 | $130,685 | $115,536 |
| 2024 | $3,675 | $241,394 | $128,123 | $113,271 |
| 2023 | $3,675 | $236,661 | $125,611 | $111,050 |
| 2022 | $3,584 | $232,022 | $123,149 | $108,873 |
| 2021 | $3,479 | $227,474 | $120,735 | $106,739 |
| 2020 | $2,755 | $225,143 | $119,498 | $105,645 |
| 2019 | $2,721 | $220,729 | $117,155 | $103,574 |
| 2018 | $2,677 | $216,402 | $114,858 | $101,544 |
| 2017 | $2,643 | $212,159 | $112,606 | $99,553 |
| 2016 | $2,538 | $208,000 | $110,399 | $97,601 |
| 2015 | $1,591 | $127,917 | $67,894 | $60,023 |
| 2014 | -- | $125,413 | $66,565 | $58,848 |
Source: Public Records
Map
Nearby Homes
- 851 S Mollison Ave Unit 29
- 969 S Mollison Ave
- 975-89 S Lincoln Ave
- 768 E Chase Ave
- 755 Anastasia Ct
- 605 S Mollison Ave Unit 205
- 1110 Monterey Dr
- 703 Taft Ave
- 410 S 1st St Unit 30
- 410 S 1st St
- 410 S 1st St Unit 175
- 410 S 1st St Unit 138
- 410 S 1st St Unit 131
- 410 S 1st St Unit 158
- 410 S 1st St Unit 35
- 410 S 1st St Unit 199
- 410 S 1st St Unit 156
- 410 S 1st St Unit 197
- 520 S Anza St Unit 42
- 471 S Lincoln Ave
- 851 S Mollison Ave Unit 35
- 851 S Mollison Ave Unit 33
- 851 S Mollison Ave Unit 14
- 851 S Mollison Ave
- 851 S Mollison Ave Unit 30
- 851 S Mollison Ave Unit 32
- 851 S Mollison Ave Unit 3
- 851 S Mollison Ave Unit 2
- 851 S Mollison Ave Unit 1
- 851 S Mollison Ave Unit 18
- 851 S Mollison Ave Unit 17
- 851 S Mollison Ave Unit 15
- 851 S Mollison Ave Unit 13
- 851 S Mollison Ave Unit 12
- 851 S Mollison Ave Unit 11
- 851 S Mollison Ave Unit 10
- 851 S Mollison Ave Unit 9
- 851 S Mollison Ave Unit 8
- 851 S Mollison Ave Unit 7
- 851 S Mollison Ave Unit 5