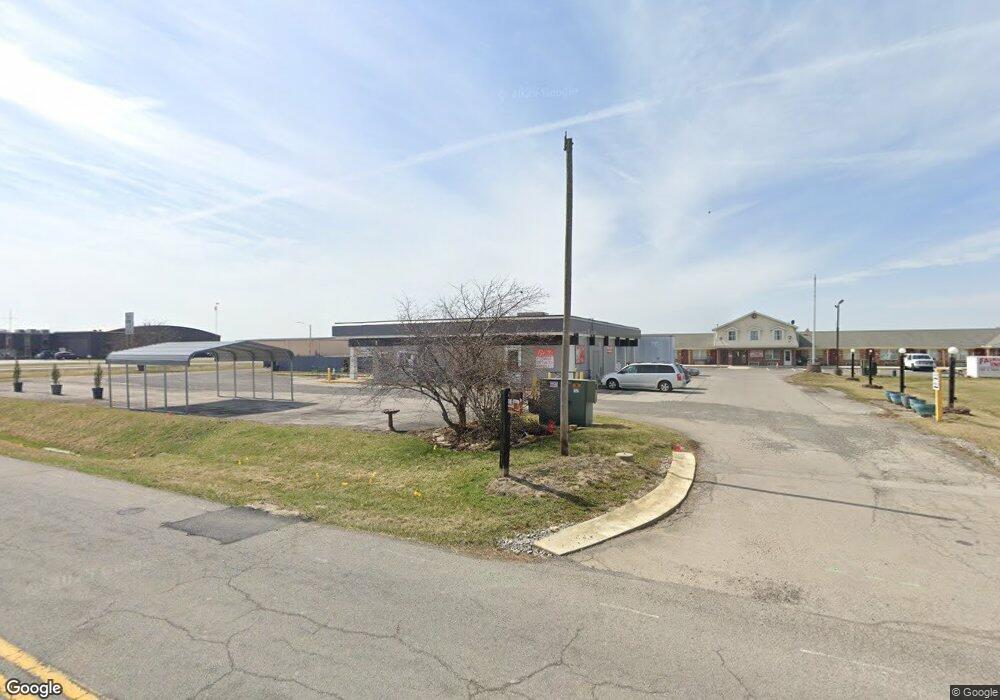
851 State Route 103 Bluffton, OH 45817
Estimated Value: $628,933
--
Bed
--
Bath
3,356
Sq Ft
$187/Sq Ft
Est. Value
About This Home
This home is located at 851 State Route 103, Bluffton, OH 45817 and is currently estimated at $628,933, approximately $187 per square foot. 851 State Route 103 is a home located in Hancock County with nearby schools including Cory-Rawson Elementary School and Cory-Rawson High School.
Ownership History
Date
Name
Owned For
Owner Type
Purchase Details
Closed on
Sep 19, 2025
Sold by
Cutting Edge Woodkraft Llc
Bought by
Id4 Properties Llc
Current Estimated Value
Purchase Details
Closed on
Jan 31, 2017
Sold by
Cutting Edge Woodkraft Llc
Bought by
Cutting Edge Woodkraft Llc
Home Financials for this Owner
Home Financials are based on the most recent Mortgage that was taken out on this home.
Original Mortgage
$151,200
Interest Rate
4.32%
Mortgage Type
Future Advance Clause Open End Mortgage
Purchase Details
Closed on
Jan 16, 2001
Sold by
Cnl Income Fun Ix Ltd
Bought by
Hj Partnership
Home Financials for this Owner
Home Financials are based on the most recent Mortgage that was taken out on this home.
Original Mortgage
$300,000
Interest Rate
7.69%
Mortgage Type
Commercial
Purchase Details
Closed on
Oct 11, 1991
Bought by
Cnl Income Fund Ix Ltd
Create a Home Valuation Report for This Property
The Home Valuation Report is an in-depth analysis detailing your home's value as well as a comparison with similar homes in the area
Home Values in the Area
Average Home Value in this Area
Purchase History
| Date | Buyer | Sale Price | Title Company |
|---|---|---|---|
| Id4 Properties Llc | -- | None Listed On Document | |
| Cutting Edge Woodkraft Llc | -- | Putnam Title Llc | |
| Hj Partnership | $300,000 | -- | |
| Cnl Income Fund Ix Ltd | $594,000 | -- |
Source: Public Records
Mortgage History
| Date | Status | Borrower | Loan Amount |
|---|---|---|---|
| Previous Owner | Cutting Edge Woodkraft Llc | $151,200 | |
| Previous Owner | Hj Partnership | $300,000 |
Source: Public Records
Tax History Compared to Growth
Tax History
| Year | Tax Paid | Tax Assessment Tax Assessment Total Assessment is a certain percentage of the fair market value that is determined by local assessors to be the total taxable value of land and additions on the property. | Land | Improvement |
|---|---|---|---|---|
| 2024 | $1,757 | $40,170 | $14,570 | $25,600 |
| 2023 | $1,767 | $40,170 | $14,570 | $25,600 |
| 2022 | $1,762 | $40,170 | $14,570 | $25,600 |
| 2021 | $1,600 | $34,290 | $7,230 | $27,060 |
| 2020 | $1,603 | $34,290 | $7,230 | $27,060 |
| 2019 | $1,582 | $34,290 | $7,230 | $27,060 |
| 2018 | $1,576 | $34,290 | $7,230 | $27,060 |
| 2017 | $787 | $34,290 | $7,230 | $27,060 |
| 2016 | $1,656 | $35,430 | $7,230 | $28,200 |
| 2015 | $2,002 | $46,050 | $14,570 | $31,480 |
| 2014 | $2,014 | $46,050 | $14,570 | $31,480 |
| 2012 | $2,068 | $46,050 | $14,570 | $31,480 |
Source: Public Records
Map
Nearby Homes
- 0 Ohio 103
- 0 State Route 103
- 222 N Lawn Ave
- 136 N Spring St
- 20515 County Road 15
- 212 S Lawn Ave
- 17297 Township Road 51
- 135 Grove St
- 217 Grove St
- 222 Grove St
- 168 Garmatter St
- 430 S Jackson St
- 513 S Jackson St
- 301 Parkview Dr
- 303 Parkview Dr
- 305 Parkview Dr
- 109 Garmatter St
- 307 Parkview Dr
- 313 Parkview Dr
- 110 Magnolia Ln
- 851 State Route
- 851 Sr
- 851 Ohio 103
- 855 Ohio 103
- 0 Navajo Dr
- 1215 Ohio 103
- 1215 S R
- 1465 State Route
- 0 Township Road 51
- 000 Township Road 51
- 668 State Route 103
- 668 State Route
- 1373 State Route 103
- 0 State Rt 103 Unit 6079294
- 0 State Rt 103
- 445 State Route 103
- 445 Sr
- 1195 County Road 33
- 0 Daves Way Unit Lot 2 217025547
- 100 Us Highway 224