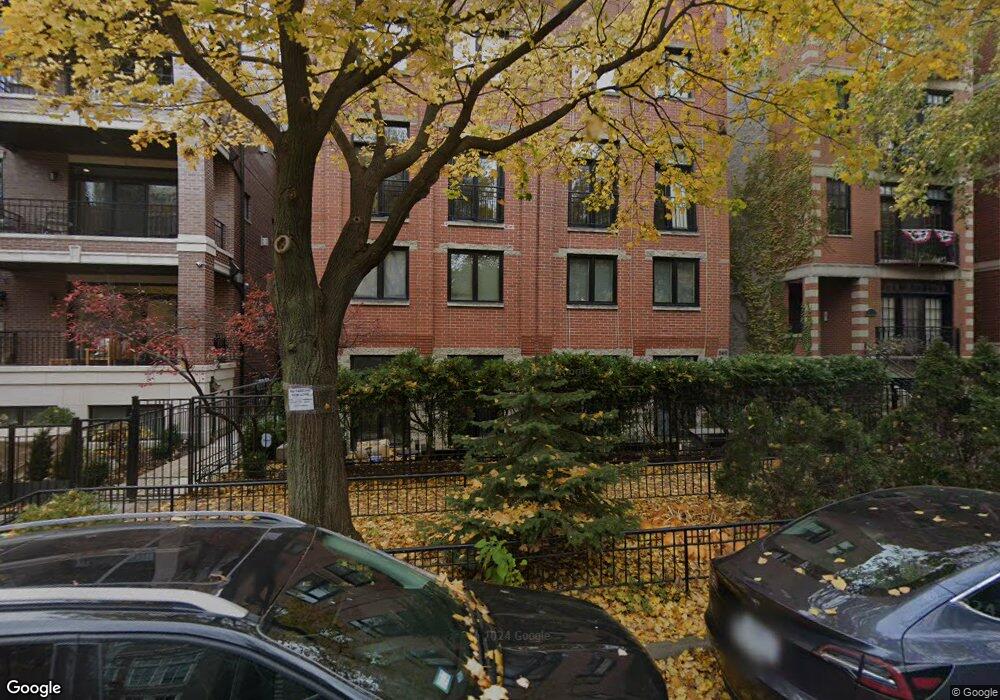
851 W Buckingham Place Unit H Chicago, IL 60657
Lakeview East NeighborhoodEstimated Value: $555,000 - $580,000
2
Beds
1
Bath
1,400
Sq Ft
$404/Sq Ft
Est. Value
About This Home
This home is located at 851 W Buckingham Place Unit H, Chicago, IL 60657 and is currently estimated at $565,087, approximately $403 per square foot. 851 W Buckingham Place Unit H is a home located in Cook County with nearby schools including Nettelhorst Elementary School, Lake View High School, and Our Lady Of Mount Carmel Academy.
Ownership History
Date
Name
Owned For
Owner Type
Purchase Details
Closed on
Aug 1, 2019
Sold by
Feldman Gary
Bought by
Berry Jason R and Berry Kelsey N
Current Estimated Value
Home Financials for this Owner
Home Financials are based on the most recent Mortgage that was taken out on this home.
Original Mortgage
$375,250
Outstanding Balance
$330,649
Interest Rate
4%
Mortgage Type
New Conventional
Estimated Equity
$234,438
Purchase Details
Closed on
Apr 1, 2014
Sold by
Allen Christopher B and Borg Brian
Bought by
Chernick Molly
Purchase Details
Closed on
Apr 22, 1999
Sold by
Riber Mitchell W
Bought by
Feldman Gary
Home Financials for this Owner
Home Financials are based on the most recent Mortgage that was taken out on this home.
Original Mortgage
$207,200
Interest Rate
7.05%
Create a Home Valuation Report for This Property
The Home Valuation Report is an in-depth analysis detailing your home's value as well as a comparison with similar homes in the area
Home Values in the Area
Average Home Value in this Area
Purchase History
| Date | Buyer | Sale Price | Title Company |
|---|---|---|---|
| Berry Jason R | $395,000 | Chicago Title | |
| Chernick Molly | $399,000 | First American Title Insuran | |
| Feldman Gary | $259,000 | -- |
Source: Public Records
Mortgage History
| Date | Status | Borrower | Loan Amount |
|---|---|---|---|
| Open | Berry Jason R | $375,250 | |
| Previous Owner | Feldman Gary | $207,200 |
Source: Public Records
Tax History Compared to Growth
Tax History
| Year | Tax Paid | Tax Assessment Tax Assessment Total Assessment is a certain percentage of the fair market value that is determined by local assessors to be the total taxable value of land and additions on the property. | Land | Improvement |
|---|---|---|---|---|
| 2024 | $8,132 | $42,038 | $13,838 | $28,200 |
| 2023 | $7,906 | $41,856 | $11,160 | $30,696 |
| 2022 | $7,906 | $41,856 | $11,160 | $30,696 |
| 2021 | $7,747 | $41,856 | $11,160 | $30,696 |
| 2020 | $6,210 | $30,978 | $4,761 | $26,217 |
| 2019 | $6,091 | $33,745 | $4,761 | $28,984 |
| 2018 | $5,987 | $33,745 | $4,761 | $28,984 |
| 2017 | $7,109 | $36,399 | $4,166 | $32,233 |
| 2016 | $6,790 | $36,399 | $4,166 | $32,233 |
| 2015 | $6,189 | $36,399 | $4,166 | $32,233 |
| 2014 | $5,395 | $31,645 | $3,403 | $28,242 |
| 2013 | $5,490 | $32,817 | $3,403 | $29,414 |
Source: Public Records
Map
Nearby Homes
- 835 W Buckingham Place Unit 2
- 3232 N Halsted St Unit H306
- 3218 N Halsted St Unit 1S
- 3219 N Halsted St Unit C
- 730 W Aldine Ave Unit 3W
- 862 W Roscoe St Unit 1
- 902 W Roscoe St Unit 4
- 901 W Belmont Ave
- 912 W Roscoe St Unit 1
- 3335 N Sheffield Ave
- 3161 N Halsted St Unit 202
- 904 W Fletcher St Unit 3
- 916 W Fletcher St Unit C
- 902 W Newport Ave
- 734 W Briar Place Unit 3
- 903 W Cornelia Ave Unit 1N
- 644 W Melrose St Unit 2E
- 647 W Melrose St Unit 5
- 3150 N Sheffield Ave Unit 612
- 754 W California Terrace Unit 1
- 849 W Buckingham Place Unit D
- 851 W Buckingham Place Unit P8
- 849 W Buckingham Place Unit G
- 849 W Buckingham Place Unit F
- 851 W Buckingham Place Unit P1
- 851 W Buckingham Place Unit P2
- 851 W Buckingham Place Unit P7
- 849 W Buckingham Place Unit A
- 851 W Buckingham Place Unit P4
- 851 W Buckingham Place Unit C
- 849 W Buckingham Place Unit F
- 851 W Buckingham Place Unit B
- 851 W Buckingham Place Unit D
- 849 W Buckingham Place Unit E
- 851 W Buckingham Place Unit P6
- 849 W Buckingham Place Unit C
- 849 W Buckingham Place Unit PH
- 849 W Buckingham Place Unit H
- 849 W Buckingham Place Unit B
- 851 W Buckingham Place Unit F