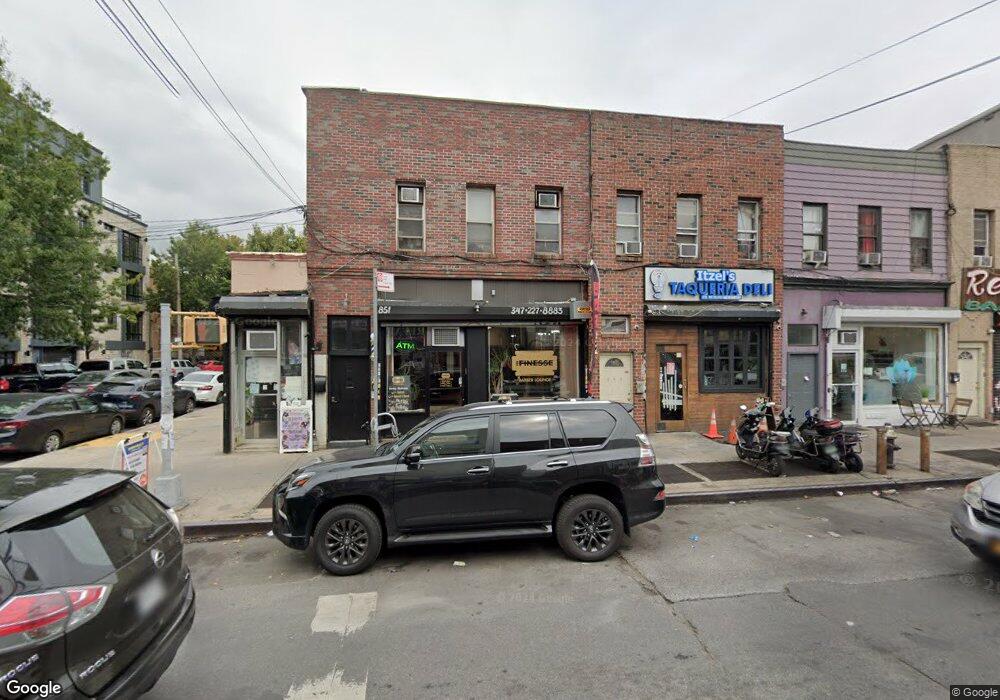
851 Wyckoff Ave Flushing, NY 11385
Ridgewood Neighborhood
--
Bed
--
Bath
1,900
Sq Ft
2,004
Sq Ft Lot
About This Home
This home is located at 851 Wyckoff Ave, Flushing, NY 11385. 851 Wyckoff Ave is a home located in Queens County with nearby schools including P.S. 239, Joseph F. Quinn Intermediate School 77, and Bushwick Ascend Lower School.
Ownership History
Date
Name
Owned For
Owner Type
Purchase Details
Closed on
Jul 17, 2024
Sold by
Lucia Capital Group Llc
Bought by
Rodriguez Luisa R and The Wyckoff And Associates Trust
Purchase Details
Closed on
Nov 22, 2013
Sold by
Duran Roger A
Bought by
Lucia Capital Group Llc
Purchase Details
Closed on
Oct 20, 2003
Sold by
Delmaro Larry
Bought by
Duran Roger A
Purchase Details
Closed on
Apr 26, 2001
Sold by
Duran Roger A and Arias Roger
Bought by
Delmaro Larry
Purchase Details
Closed on
Aug 27, 1998
Sold by
Duran Martina A
Bought by
Duran Roger A and Arias Roger
Purchase Details
Closed on
Jan 5, 1997
Sold by
Duran Martina A
Bought by
Duran Martina A and Arias Roger
Home Financials for this Owner
Home Financials are based on the most recent Mortgage that was taken out on this home.
Original Mortgage
$136,500
Interest Rate
6.8%
Mortgage Type
Commercial
Create a Home Valuation Report for This Property
The Home Valuation Report is an in-depth analysis detailing your home's value as well as a comparison with similar homes in the area
Home Values in the Area
Average Home Value in this Area
Purchase History
| Date | Buyer | Sale Price | Title Company |
|---|---|---|---|
| Rodriguez Luisa R | -- | -- | |
| Lucia Capital Group Llc | -- | -- | |
| Lucia Capital Group Llc | -- | -- | |
| Duran Roger A | -- | -- | |
| Duran Roger A | -- | -- | |
| Delmaro Larry | -- | -- | |
| Delmaro Larry | -- | -- | |
| Duran Roger A | -- | -- | |
| Duran Roger A | -- | -- | |
| Duran Martina A | -- | Stewart Title Insurance Co | |
| Duran Martina A | -- | Stewart Title Insurance Co |
Source: Public Records
Mortgage History
| Date | Status | Borrower | Loan Amount |
|---|---|---|---|
| Previous Owner | Duran Martina A | $136,500 |
Source: Public Records
Tax History Compared to Growth
Tax History
| Year | Tax Paid | Tax Assessment Tax Assessment Total Assessment is a certain percentage of the fair market value that is determined by local assessors to be the total taxable value of land and additions on the property. | Land | Improvement |
|---|---|---|---|---|
| 2025 | $12,393 | $105,750 | $60,300 | $45,450 |
| 2024 | $12,393 | $117,000 | $60,300 | $56,700 |
| 2023 | $14,013 | $132,300 | $60,300 | $72,000 |
| 2022 | $13,842 | $133,200 | $60,300 | $72,900 |
| 2021 | $13,205 | $133,200 | $60,300 | $72,900 |
| 2020 | $12,186 | $132,750 | $60,300 | $72,450 |
| 2019 | $9,602 | $127,350 | $60,300 | $67,050 |
| 2018 | $7,159 | $68,086 | $37,901 | $30,185 |
| 2017 | $4,933 | $46,916 | $26,702 | $20,214 |
| 2016 | $2,932 | $46,916 | $26,702 | $20,214 |
| 2015 | $1,423 | $11,146 | $4,304 | $6,842 |
| 2014 | $1,423 | $11,146 | $5,168 | $5,978 |
Source: Public Records
Map
Nearby Homes
- 855 Wyckoff Ave
- 1497 Jefferson Ave
- 1489 Jefferson Ave
- 16-66 Jefferson Ave
- 1493 Putnam Ave
- 1405 Hancock St Unit 3A
- 455 Irving Ave
- 16 Ridgewood Place Unit 2
- 479 Irving Ave
- 1619 George St
- 1623 George St
- 321 Cornelia St
- 373 Palmetto St Unit 4 B
- 1536 Gates Ave
- 1597 Gates Ave
- 311 Saint Nicholas Ave Unit 3H
- 302 Weirfield St
- 1524 Myrtle Ave
- 1231 Halsey St
- 16-23 Norman St
- 16-02 Wyckoff Ave
- 853 Wyckoff Ave
- 855 Wyckoff Ave Unit 1
- 855 Wyckoff Ave Unit 2
- 1609 Jefferson Ave
- 859 Wyckoff Ave
- 1611 Jefferson Ave
- 1614 Cornelia St Unit 1
- 1614 Cornelia St
- 1614 Cornelia St Unit 1
- 16-09 Jefferson Ave
- 861 Wyckoff Ave Unit Store
- 861 Wyckoff Ave Unit 2
- 861 Wyckoff Ave
- 16-11 Cornelia St
- 1618 Cornelia St
- 1611 Cornelia St
- 1613 Cornelia St
- 1615 Cornelia St
- 1615 Cornelia St Unit 2ND FLOOR