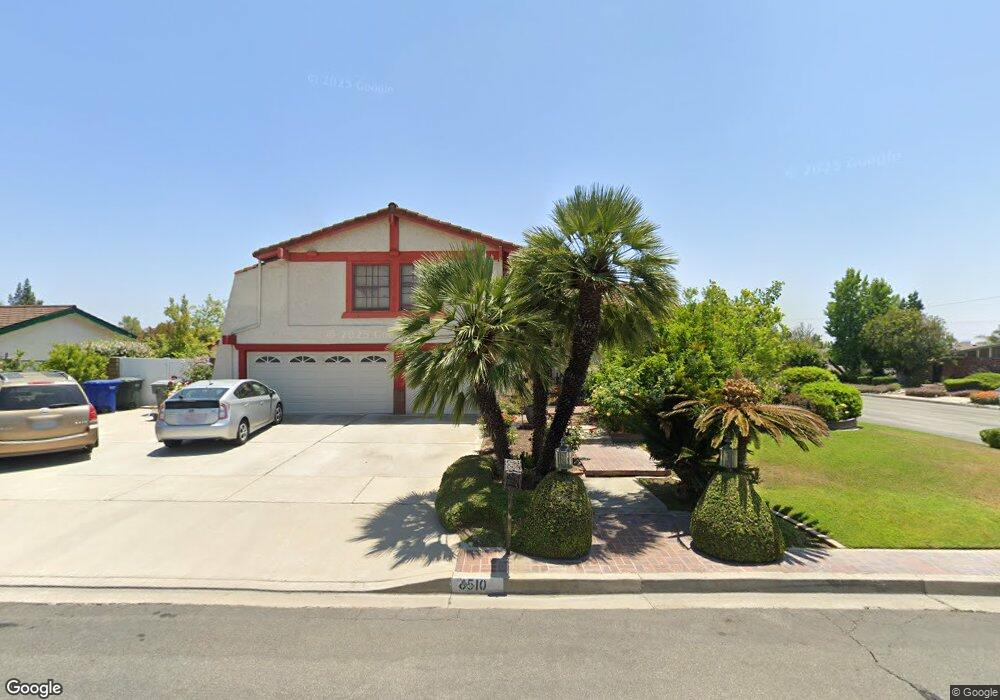
8510 Cypress Point Buena Park, CA 90621
Estimated Value: $1,252,000 - $1,532,000
3
Beds
3
Baths
2,760
Sq Ft
$504/Sq Ft
Est. Value
About This Home
This home is located at 8510 Cypress Point, Buena Park, CA 90621 and is currently estimated at $1,391,688, approximately $504 per square foot. 8510 Cypress Point is a home with nearby schools including Charles G. Emery Elementary School, Buena Park Junior High School, and Sunny Hills High School.
Ownership History
Date
Name
Owned For
Owner Type
Purchase Details
Closed on
Sep 16, 2015
Sold by
Regullano Jose and Regullano Maria Elena
Bought by
Regullano Jose and Regullano Elena Regullano F
Current Estimated Value
Purchase Details
Closed on
Oct 17, 2003
Sold by
Regullano Jose B and Elena Regullano M
Bought by
Regullano Jose B and Elena Regullano M
Home Financials for this Owner
Home Financials are based on the most recent Mortgage that was taken out on this home.
Original Mortgage
$285,100
Interest Rate
6.14%
Mortgage Type
Purchase Money Mortgage
Purchase Details
Closed on
Jul 14, 2002
Sold by
Regullano Jose B and Elena Regullano M
Bought by
Regullano Jose B and Elena Regullano M
Create a Home Valuation Report for This Property
The Home Valuation Report is an in-depth analysis detailing your home's value as well as a comparison with similar homes in the area
Home Values in the Area
Average Home Value in this Area
Purchase History
| Date | Buyer | Sale Price | Title Company |
|---|---|---|---|
| Regullano Jose | -- | None Available | |
| Regullano Jose | -- | None Available | |
| Regullano Jose B | -- | -- | |
| Regullano Jose B | -- | -- |
Source: Public Records
Mortgage History
| Date | Status | Borrower | Loan Amount |
|---|---|---|---|
| Closed | Regullano Jose B | $285,100 |
Source: Public Records
Tax History Compared to Growth
Tax History
| Year | Tax Paid | Tax Assessment Tax Assessment Total Assessment is a certain percentage of the fair market value that is determined by local assessors to be the total taxable value of land and additions on the property. | Land | Improvement |
|---|---|---|---|---|
| 2025 | $10,259 | $938,293 | $651,295 | $286,998 |
| 2024 | $10,259 | $919,896 | $638,525 | $281,371 |
| 2023 | $10,053 | $901,859 | $626,005 | $275,854 |
| 2022 | $9,896 | $884,176 | $613,730 | $270,446 |
| 2021 | $9,824 | $866,840 | $601,696 | $265,144 |
| 2020 | $9,702 | $857,952 | $595,526 | $262,426 |
| 2019 | $9,462 | $841,130 | $583,849 | $257,281 |
| 2018 | $9,276 | $824,638 | $572,401 | $252,237 |
| 2017 | $9,144 | $808,469 | $561,177 | $247,292 |
| 2016 | $8,958 | $792,617 | $550,173 | $242,444 |
| 2015 | $8,561 | $780,712 | $541,909 | $238,803 |
| 2014 | $8,538 | $765,419 | $531,293 | $234,126 |
Source: Public Records
Map
Nearby Homes
- 8542 Emerywood Dr
- 9 Coveside Ct
- 8237 Henshaw Cir
- 5412 Arrowhead Ave
- 5211 Fox Hills Ave
- 65 Windward Way Unit 23
- 5471 Jonesboro Way
- 86 Lakeside Dr
- 8244 Henderson Green
- 6 Tidewater Cove
- 5588 Cajon Ave
- 11 Travis Rd
- 4900 Lincolnshire Ave
- 5941 Stanton Ave
- 4738 Durango Dr
- 4014 W Commonwealth Ave
- 101 Turner Ave
- 2523 Cypress Point Dr
- 5822 Fullerton Ave
- 8325 Beethoven Dr
- 8532 Cypress Point
- 8511 Travistuck Place
- 8521 Travistuck Place
- 5461 Kenwood Ave
- 5441 Kenwood Ave
- 5420 Kenwood Ave
- 5481 Kenwood Ave
- 8562 Cypress Point
- 8531 Cypress Point
- 8551 Travistuck Place
- 5431 Kenwood Ave
- 5491 Kenwood Ave
- 8551 Cypress Point
- 5421 Kenwood Ave
- 8561 Travistuck Place
- 8561 Travistuck Place
- 8514 Travistuck Place
- 5462 Burlingame Ave
- 5442 Burlingame Ave
- 5400 Kenwood Ave