
Seller's Agent in 2013
Lisa Moore
Compass Realty Group
(816) 280-2773
6 in this area
371 Total Sales
Estimated Value: $481,000 - $506,000
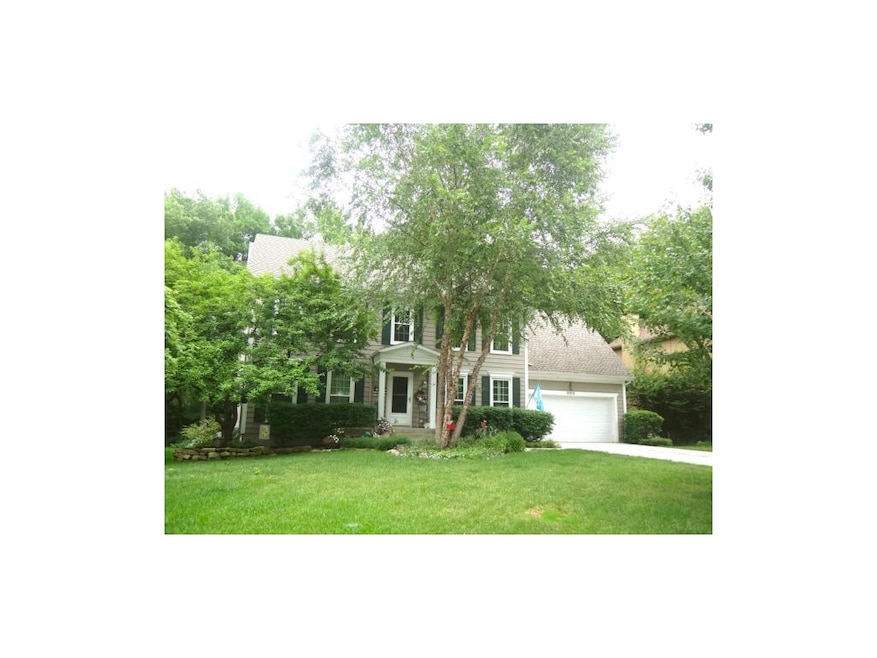
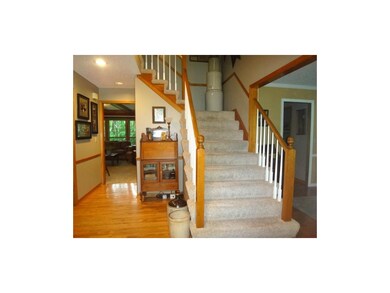
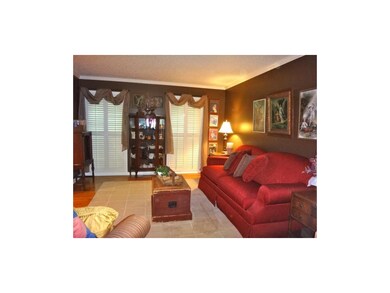
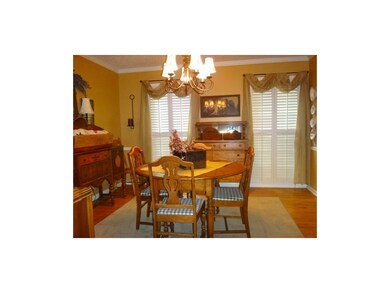
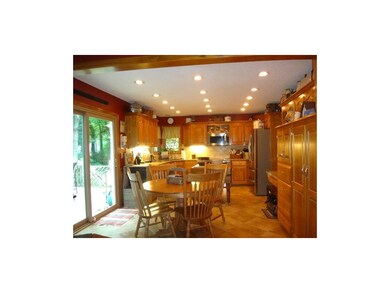
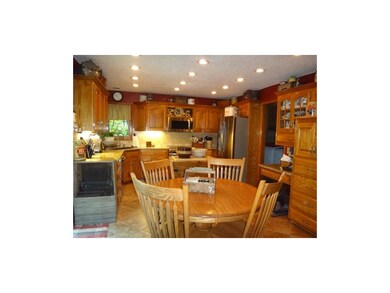
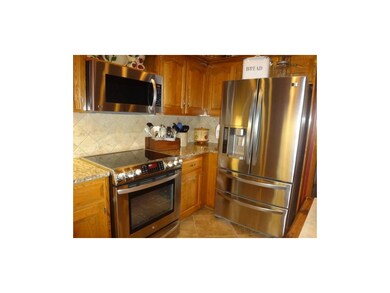
Honey stop the car! Totally updated 2 sty in coveted Brookwood Pl. Newer items include: frieze carpet, ceramic tile, S/S appliances, granite, plumb & light fix, windows, roof, HVAC, plantation shutters, finished basement w/wetbar, home gym & rec rm. Master w/sep sitting rm w/F/P & wlk-clsts. Deck, sprinklers & plush landscaping. Community pool>> Fresh paint, super clean, close to schools. shopping & quick highway access to 435. Better hurry!
Last Agent to Sell the Property
Compass Realty Group License #SP00053464 Listed on: 08/09/2013
| Date | Buyer | Sale Price | Title Company |
|---|---|---|---|
| Borghardt Aaron S | -- | Kansas City Title Inc |
| Date | Status | Borrower | Loan Amount |
|---|---|---|---|
| Open | Borghardt Aaron S | $237,500 |
| Date | Event | Price | List to Sale | Price per Sq Ft |
|---|---|---|---|---|
| 09/12/2013 09/12/13 | Sold | -- | -- | -- |
| 08/18/2013 08/18/13 | Pending | -- | -- | -- |
| 08/09/2013 08/09/13 | For Sale | $250,000 | -- | $70 / Sq Ft |
| Year | Tax Paid | Tax Assessment Tax Assessment Total Assessment is a certain percentage of the fair market value that is determined by local assessors to be the total taxable value of land and additions on the property. | Land | Improvement |
|---|---|---|---|---|
| 2025 | $5,678 | $54,568 | $11,193 | $43,375 |
| 2024 | $5,678 | $51,244 | $10,175 | $41,069 |
| 2023 | $5,482 | $48,714 | $9,252 | $39,462 |
| 2022 | $4,911 | $43,608 | $8,408 | $35,200 |
| 2021 | $4,710 | $39,732 | $7,645 | $32,087 |
| 2020 | $4,450 | $37,156 | $7,645 | $29,511 |
| 2019 | $4,183 | $34,891 | $6,373 | $28,518 |
| 2018 | $4,115 | $34,017 | $6,373 | $27,644 |
| 2017 | $4,053 | $32,476 | $5,798 | $26,678 |
| 2016 | $3,948 | $31,245 | $5,275 | $25,970 |
| 2015 | $3,754 | $29,900 | $5,275 | $24,625 |
| 2013 | -- | $26,668 | $5,275 | $21,393 |
Seller's Agent in 2013
Lisa Moore
Compass Realty Group
(816) 280-2773
6 in this area
371 Total Sales
Seller Co-Listing Agent in 2013
Angelo Zuniga
Platinum Realty LLC
(913) 660-3032
3 in this area
18 Total Sales
B
Buyer's Agent in 2013
Bob Ludwig
ReeceNichols -The Village
(913) 638-8370
1 in this area
35 Total Sales
Source: Heartland MLS
MLS Number: 1845234
APN: IP07250000-0008
Disclaimer: Certain information contained herein is derived from information provided by parties other than Homes.com. All information provided is deemed reliable, but is not guaranteed to be accurate and should be independently verified.
![]() Based on information submitted to the MLS Grid. All data is obtained from various sources and may not have been verified by broker or MLS GRID. Supplied Open House Information is subject to change without notice. All information should be independently reviewed and verified for accuracy. Properties may or may not be listed by the office/agent presenting the information. Some IDX listings have been excluded from this website. Prices displayed on all Sold listings are the Last Known Listing Price and may not be the actual selling price.
Based on information submitted to the MLS Grid. All data is obtained from various sources and may not have been verified by broker or MLS GRID. Supplied Open House Information is subject to change without notice. All information should be independently reviewed and verified for accuracy. Properties may or may not be listed by the office/agent presenting the information. Some IDX listings have been excluded from this website. Prices displayed on all Sold listings are the Last Known Listing Price and may not be the actual selling price.
Listing Information presented by local MLS brokerage: TEN-X, INC., local REALTOR®- Arlene Richardson - (888) 952-6393
Based on information submitted to the MLS GRID.
Ask me questions while you tour the home.