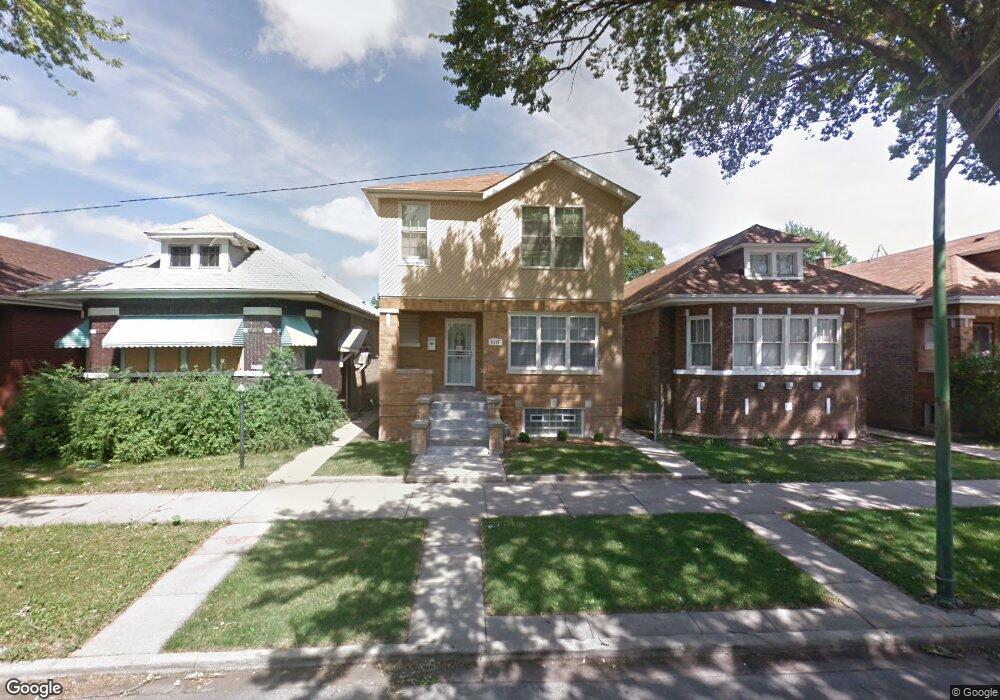
8515 S Justine St Chicago, IL 60620
Auburn Gresham NeighborhoodEstimated Value: $205,000 - $332,000
5
Beds
3
Baths
1,545
Sq Ft
$183/Sq Ft
Est. Value
About This Home
This home is located at 8515 S Justine St, Chicago, IL 60620 and is currently estimated at $282,639, approximately $182 per square foot. 8515 S Justine St is a home located in Cook County with nearby schools including Cuffe Math-Sci Tech Elementary Academy, Emil G. Hirsch Metropolitan High School, and LEARN Hunter Perkins.
Ownership History
Date
Name
Owned For
Owner Type
Purchase Details
Closed on
Oct 25, 2010
Sold by
Orchard Street Property Group Llc
Bought by
Mccoy Carita
Current Estimated Value
Home Financials for this Owner
Home Financials are based on the most recent Mortgage that was taken out on this home.
Original Mortgage
$190,389
Outstanding Balance
$133,244
Interest Rate
5.5%
Mortgage Type
FHA
Estimated Equity
$149,395
Purchase Details
Closed on
Jan 4, 2010
Sold by
Homesales Inc
Bought by
Orchard Street Property Group Llc
Home Financials for this Owner
Home Financials are based on the most recent Mortgage that was taken out on this home.
Original Mortgage
$100,000
Interest Rate
5.01%
Mortgage Type
Unknown
Purchase Details
Closed on
Oct 20, 2009
Sold by
Williams Robert
Bought by
Homesales Inc
Purchase Details
Closed on
Jul 19, 2007
Sold by
Atlantic Municipal Corp
Bought by
Coles Chavonna
Purchase Details
Closed on
Jan 26, 2007
Sold by
Bryson John T
Bought by
Atlantic Municipal Corp
Create a Home Valuation Report for This Property
The Home Valuation Report is an in-depth analysis detailing your home's value as well as a comparison with similar homes in the area
Home Values in the Area
Average Home Value in this Area
Purchase History
| Date | Buyer | Sale Price | Title Company |
|---|---|---|---|
| Mccoy Carita | $193,000 | None Available | |
| Orchard Street Property Group Llc | $15,500 | Cti | |
| Homesales Inc | -- | None Available | |
| Coles Chavonna | -- | None Available | |
| Atlantic Municipal Corp | $95,500 | None Available |
Source: Public Records
Mortgage History
| Date | Status | Borrower | Loan Amount |
|---|---|---|---|
| Open | Mccoy Carita | $190,389 | |
| Previous Owner | Orchard Street Property Group Llc | $100,000 |
Source: Public Records
Tax History Compared to Growth
Tax History
| Year | Tax Paid | Tax Assessment Tax Assessment Total Assessment is a certain percentage of the fair market value that is determined by local assessors to be the total taxable value of land and additions on the property. | Land | Improvement |
|---|---|---|---|---|
| 2024 | $4,153 | $18,000 | $1,875 | $16,125 |
| 2023 | $4,027 | $23,001 | $2,438 | $20,563 |
| 2022 | $4,027 | $23,001 | $2,438 | $20,563 |
| 2021 | $3,955 | $22,999 | $2,437 | $20,562 |
| 2020 | $2,293 | $13,394 | $2,437 | $10,957 |
| 2019 | $2,268 | $14,719 | $2,437 | $12,282 |
| 2018 | $2,229 | $14,719 | $2,437 | $12,282 |
| 2017 | $2,785 | $16,312 | $2,250 | $14,062 |
| 2016 | $2,767 | $16,312 | $2,250 | $14,062 |
| 2015 | $2,508 | $16,312 | $2,250 | $14,062 |
| 2014 | $1,764 | $12,074 | $2,062 | $10,012 |
| 2013 | $1,718 | $12,074 | $2,062 | $10,012 |
Source: Public Records
Map
Nearby Homes
- 8557 S Justine St
- 8633 S Ashland Ave
- 8630 S Bishop St
- 8521 S Loomis Blvd
- 8620 S Marshfield Ave
- 8351 S Marshfield Ave
- 8358 S Ada St
- 8633 S Hermitage Ave
- 8718 S Marshfield Ave
- 8357 S Hermitage Ave
- 8624 S Throop St
- 8259 S Marshfield Ave
- 8245 S Justine St
- 8252 S Marshfield Ave
- 8242 S Marshfield Ave
- 8622 S Wood St
- 8217 S Justine St
- 8808 S Loomis St
- 8212 S Bishop St
- 8411 S Elizabeth St
- 8517 S Justine St
- 8511 S Justine St
- 8507 S Justine St
- 8521 S Justine St
- 8505 S Justine St
- 8523 S Justine St
- 8525 S Justine St
- 8501 S Justine St
- 8512 S Laflin St
- 8510 S Laflin St
- 8516 S Laflin St
- 8506 S Laflin St
- 8531 S Justine St
- 8520 S Laflin St
- 8504 S Laflin St
- 8524 S Laflin St
- 8500 S Laflin St
- 8514 S Justine St
- 8510 S Justine St
- 8516 S Justine St