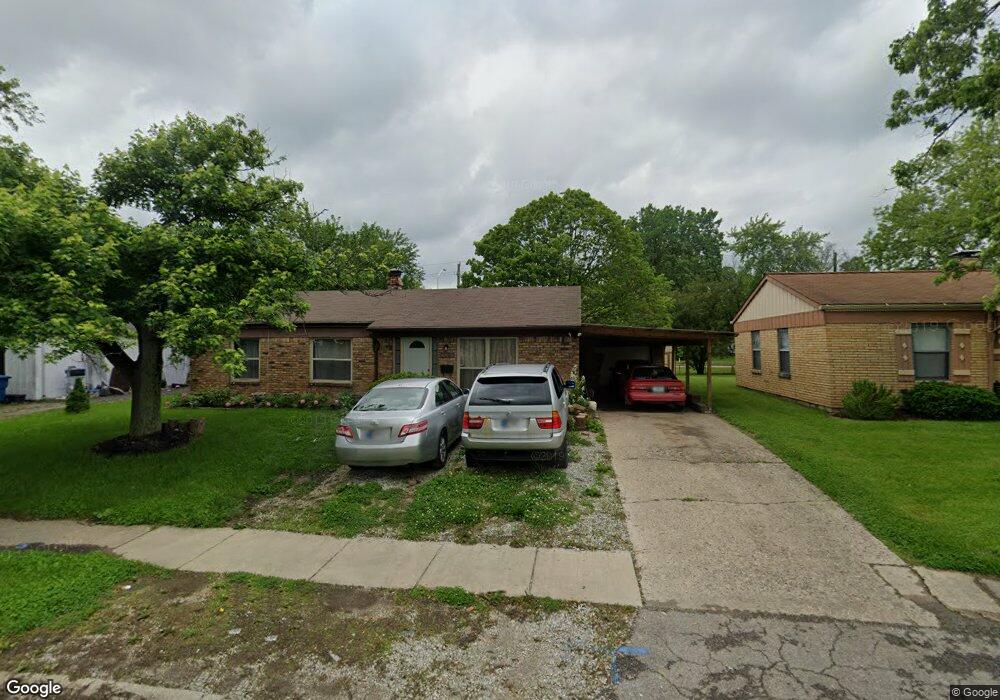
8516 E 37th Place Indianapolis, IN 46226
Far Eastside NeighborhoodEstimated Value: $146,000 - $165,000
3
Beds
2
Baths
1,189
Sq Ft
$130/Sq Ft
Est. Value
About This Home
This home is located at 8516 E 37th Place, Indianapolis, IN 46226 and is currently estimated at $154,593, approximately $130 per square foot. 8516 E 37th Place is a home located in Marion County with nearby schools including Robert Lee Frost School 106, James Whitcomb Riley School 43, and Charles Warren Fairbanks School 105.
Ownership History
Date
Name
Owned For
Owner Type
Purchase Details
Closed on
Aug 14, 2018
Sold by
Gallardo Diego Jose A
Bought by
Galeana Virginia Diego
Current Estimated Value
Purchase Details
Closed on
Sep 19, 2014
Sold by
Ball Mildred
Bought by
Diego Jose A Gallardo
Purchase Details
Closed on
Jul 13, 2008
Sold by
Ball Lionel
Bought by
Ball Lionel and Ball Mildred
Purchase Details
Closed on
Feb 11, 2008
Sold by
Aurora Loan Services Llc
Bought by
Ball Lionel
Purchase Details
Closed on
Nov 28, 2007
Sold by
Moore Albert J
Bought by
Aurora Loan Services Llc
Purchase Details
Closed on
Jan 11, 2006
Sold by
Anderson Jeffrey Alan
Bought by
Moore Albert J
Home Financials for this Owner
Home Financials are based on the most recent Mortgage that was taken out on this home.
Original Mortgage
$60,000
Interest Rate
10.45%
Mortgage Type
Adjustable Rate Mortgage/ARM
Create a Home Valuation Report for This Property
The Home Valuation Report is an in-depth analysis detailing your home's value as well as a comparison with similar homes in the area
Home Values in the Area
Average Home Value in this Area
Purchase History
| Date | Buyer | Sale Price | Title Company |
|---|---|---|---|
| Galeana Virginia Diego | -- | None Available | |
| Diego Jose A Gallardo | -- | Mtc | |
| Ball Lionel | -- | None Available | |
| Ball Lionel | -- | Security Title Services Llc | |
| Aurora Loan Services Llc | $46,800 | None Available | |
| Moore Albert J | -- | Investors Titlecorp |
Source: Public Records
Mortgage History
| Date | Status | Borrower | Loan Amount |
|---|---|---|---|
| Previous Owner | Moore Albert J | $60,000 |
Source: Public Records
Tax History
| Year | Tax Paid | Tax Assessment Tax Assessment Total Assessment is a certain percentage of the fair market value that is determined by local assessors to be the total taxable value of land and additions on the property. | Land | Improvement |
|---|---|---|---|---|
| 2025 | $943 | $123,200 | $12,000 | $111,200 |
| 2024 | $1,113 | $103,900 | $12,000 | $91,900 |
| 2023 | $1,113 | $107,700 | $12,000 | $95,700 |
| 2022 | $1,041 | $96,200 | $12,000 | $84,200 |
| 2021 | $777 | $79,200 | $12,000 | $67,200 |
| 2020 | $595 | $69,200 | $10,600 | $58,600 |
| 2019 | $585 | $66,900 | $10,600 | $56,300 |
| 2018 | $562 | $62,300 | $10,600 | $51,700 |
| 2017 | $472 | $58,100 | $10,600 | $47,500 |
| 2016 | $422 | $54,100 | $10,600 | $43,500 |
| 2014 | $391 | $54,400 | $10,600 | $43,800 |
| 2013 | $1,154 | $55,500 | $10,600 | $44,900 |
Source: Public Records
Map
Nearby Homes
- 3848 Richelieu Rd
- 3909 Richelieu Ct
- 3930 Chateau Dr
- 3851 Esquire Place
- 3976 Marseille Rd
- 8445 Montery Rd
- 3938 Biscayne Rd
- 8619 Montery Rd
- 8704 Montery Rd
- 3538 Harvest Ave
- 4040 Aspen Way
- 8337 Aspen Ct
- 3532 Harvest Ave
- 8724 Montery Rd
- 3537 Cecil Ave
- 3432 N Eaton Ave
- 3514 Harvest Ave
- 3950 Malibu Ct
- 4019 Biscayne Rd
- 3449 Seine Ct
- 8522 E 37th Place
- 8510 E 37th Place
- 8528 E 37th Place
- 8504 E 37th Place
- 8519 E 37th Place
- 8513 E 37th Place
- 8534 E 37th Place
- 8446 E 37th Place
- 8525 E 37th Place
- 8503 E 37th Place
- 8531 E 37th Place
- 3805 Marseille Rd
- 8438 E 37th Place
- 8537 E 37th Place
- 3720 Chateau Ct
- 3727 Marseille Rd
- 3806 Richelieu Rd
- 8439 E 37th Place
- 8543 E 37th Place
- 8432 E 37th Place
Your Personal Tour Guide
Ask me questions while you tour the home.