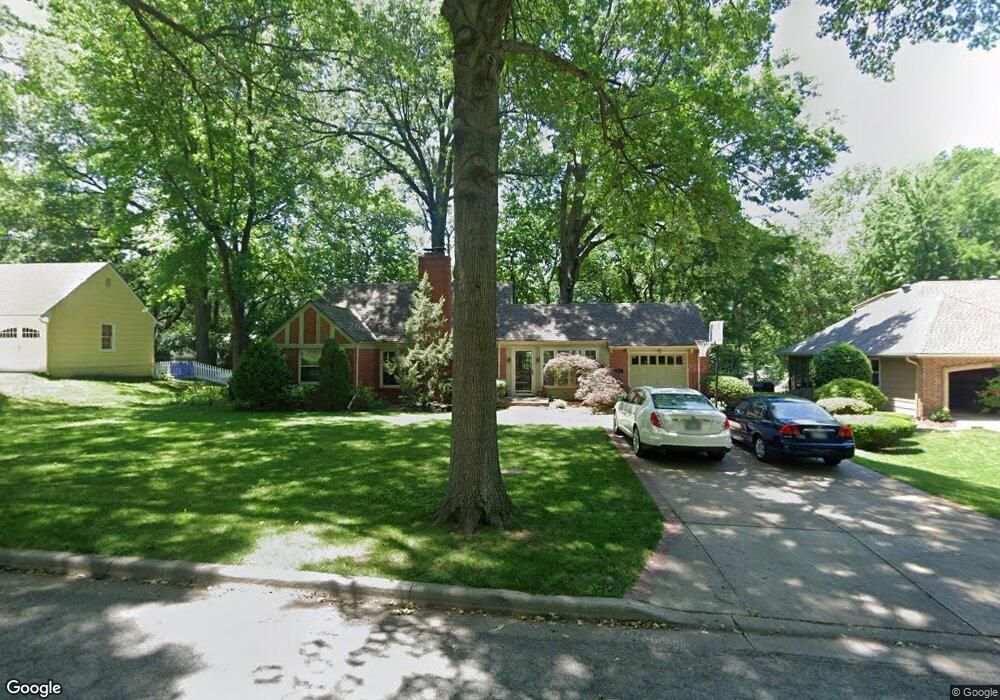
8516 Sagamore Rd Leawood, KS 66206
Estimated Value: $504,000 - $582,000
3
Beds
2
Baths
1,677
Sq Ft
$325/Sq Ft
Est. Value
About This Home
This home is located at 8516 Sagamore Rd, Leawood, KS 66206 and is currently estimated at $544,913, approximately $324 per square foot. 8516 Sagamore Rd is a home located in Johnson County with nearby schools including Indian Hills Middle School, Shawnee Mission East High School, and Highlawn Montessori School.
Ownership History
Date
Name
Owned For
Owner Type
Purchase Details
Closed on
Jun 27, 2005
Sold by
Thompson Laurie A and Thompson Timothy N
Bought by
Moran Jill C and Tyler Daniel
Current Estimated Value
Home Financials for this Owner
Home Financials are based on the most recent Mortgage that was taken out on this home.
Original Mortgage
$186,400
Outstanding Balance
$97,366
Interest Rate
5.67%
Mortgage Type
New Conventional
Estimated Equity
$447,547
Purchase Details
Closed on
Mar 20, 2002
Sold by
Moser Carol A and Moser John W
Bought by
Thompson Laurie A
Home Financials for this Owner
Home Financials are based on the most recent Mortgage that was taken out on this home.
Original Mortgage
$196,800
Interest Rate
6.5%
Purchase Details
Closed on
Jul 6, 2001
Sold by
Moser Carol A and Moser John W
Bought by
Moser John W and Moser Carol A
Home Financials for this Owner
Home Financials are based on the most recent Mortgage that was taken out on this home.
Original Mortgage
$229,500
Interest Rate
7.2%
Create a Home Valuation Report for This Property
The Home Valuation Report is an in-depth analysis detailing your home's value as well as a comparison with similar homes in the area
Home Values in the Area
Average Home Value in this Area
Purchase History
| Date | Buyer | Sale Price | Title Company |
|---|---|---|---|
| Moran Jill C | -- | Chicago Title Ins Co | |
| Thompson Laurie A | -- | Chicago Title Insurance Co | |
| Moser John W | -- | Ati Title Company |
Source: Public Records
Mortgage History
| Date | Status | Borrower | Loan Amount |
|---|---|---|---|
| Open | Moran Jill C | $186,400 | |
| Previous Owner | Thompson Laurie A | $196,800 | |
| Previous Owner | Moser John W | $229,500 | |
| Closed | Thompson Laurie A | $36,100 |
Source: Public Records
Tax History Compared to Growth
Tax History
| Year | Tax Paid | Tax Assessment Tax Assessment Total Assessment is a certain percentage of the fair market value that is determined by local assessors to be the total taxable value of land and additions on the property. | Land | Improvement |
|---|---|---|---|---|
| 2024 | $4,737 | $45,206 | $27,756 | $17,450 |
| 2023 | $4,537 | $42,780 | $25,239 | $17,541 |
| 2022 | $3,787 | $35,857 | $22,940 | $12,917 |
| 2021 | $3,766 | $34,063 | $22,940 | $11,123 |
| 2020 | $3,878 | $39,399 | $20,846 | $18,553 |
| 2019 | $3,862 | $34,489 | $17,377 | $17,112 |
| 2018 | $3,504 | $31,212 | $17,377 | $13,835 |
| 2017 | $3,658 | $32,062 | $13,360 | $18,702 |
| 2016 | $3,527 | $30,533 | $10,280 | $20,253 |
| 2015 | $3,406 | $29,727 | $10,244 | $19,483 |
| 2013 | -- | $28,635 | $8,532 | $20,103 |
Source: Public Records
Map
Nearby Homes
- 8600 Sagamore Rd
- 2110 W 86th St
- 2108 W 86th St
- 2106 W 86th St
- 2104 W 86th St
- 2102 W 86th St
- 2100 W 86th St
- 8429 Meadow Ln
- 8700 Lee Blvd
- 2508 W 88th St
- 8514 Belinder Rd
- 8324 Meadow Ln
- 8804 Lee Blvd
- 2816 W 87th Terrace
- 1113 W 85th St
- 2144 W 89th Terrace
- 8303 Ward Pkwy
- 9001 Lee Blvd
- 8927 High Dr
- 2019 W 81st Terrace
- 8510 Sagamore Rd
- 8521 High Dr
- 8517 High Dr
- 8525 High Dr
- 2201 W 85th Terrace
- 8604 Sagamore Rd
- 8507 High Dr
- 8601 Sagamore Rd
- 2027 W 85th Terrace
- 2024 W 86th St
- 8611 Sagamore Rd
- 2023 W 85th Terrace
- 8516 High Dr
- 8520 High Dr
- 8612 Sagamore Rd
- 8533 High Dr
- 8510 High Dr
- 8524 High Dr
- 8500 High Dr
- 2019 W 86th St