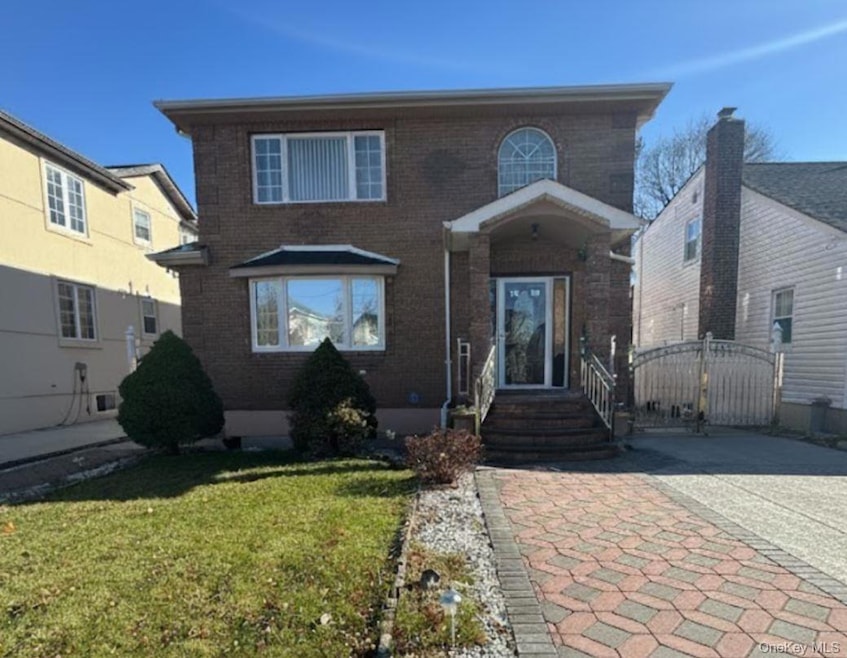
8519 239th St Bellerose, NY 11426
Bellerose NeighborhoodHighlights
- Colonial Architecture
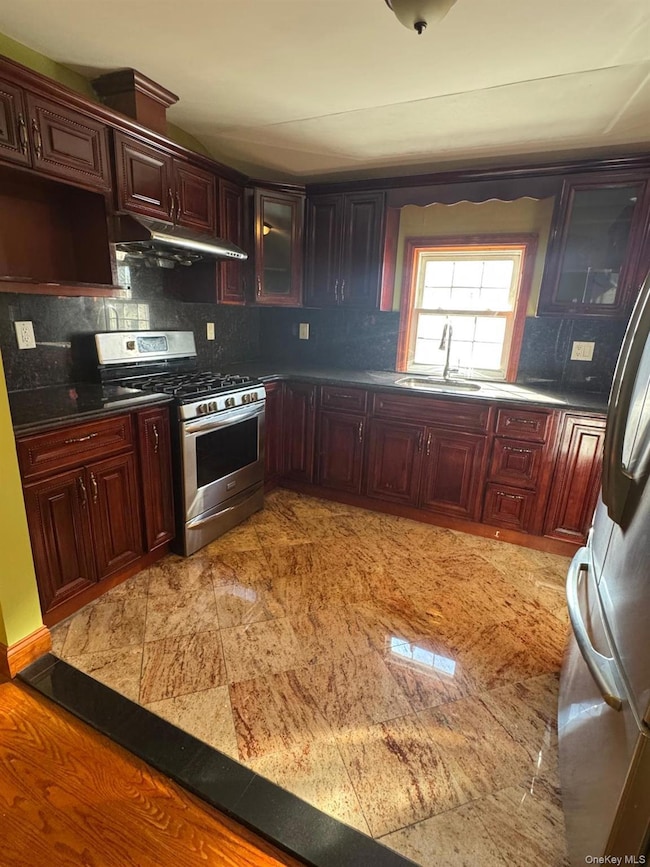
- Granite Countertops
- Forced Air Heating and Cooling System
- P.S. 18 Q The Winchester School Rated A
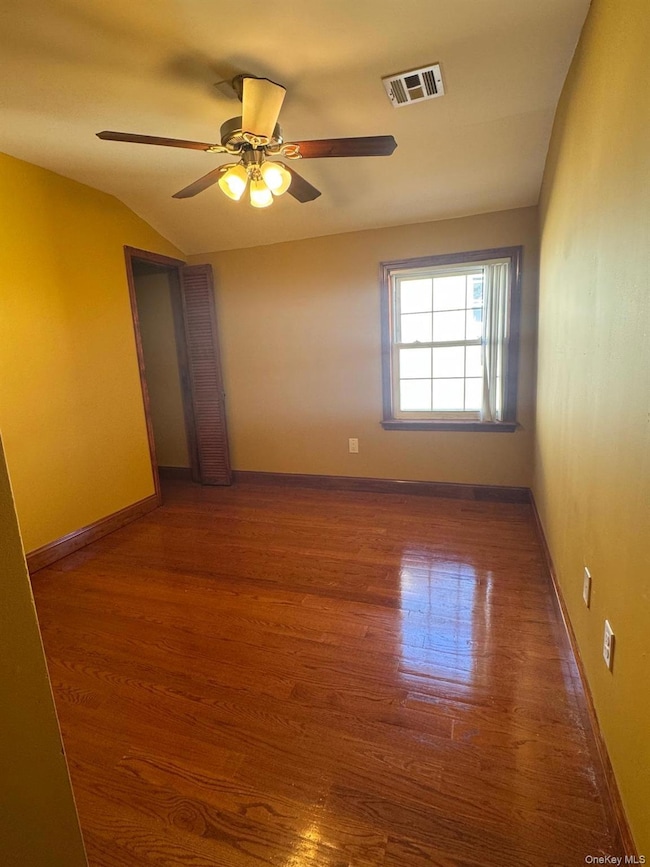
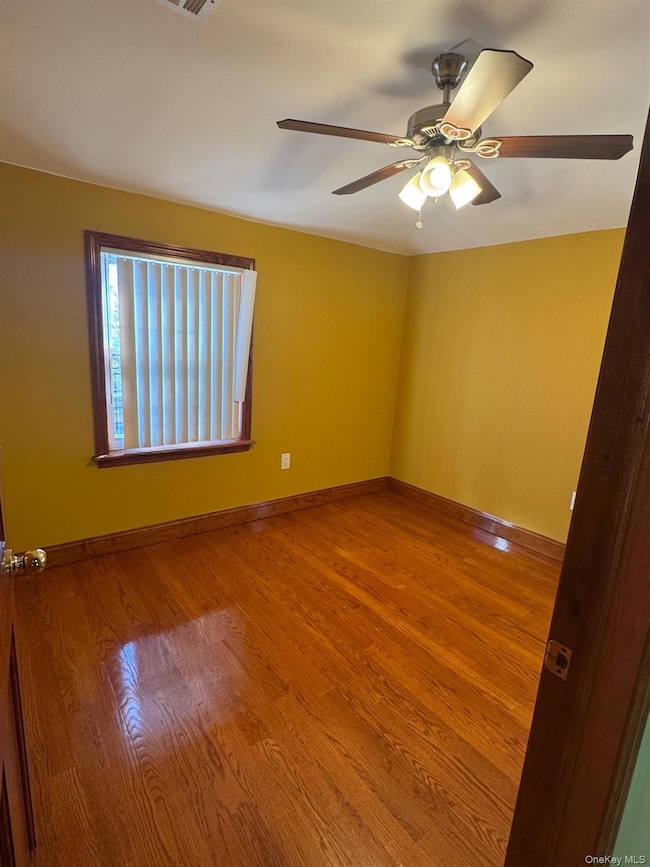
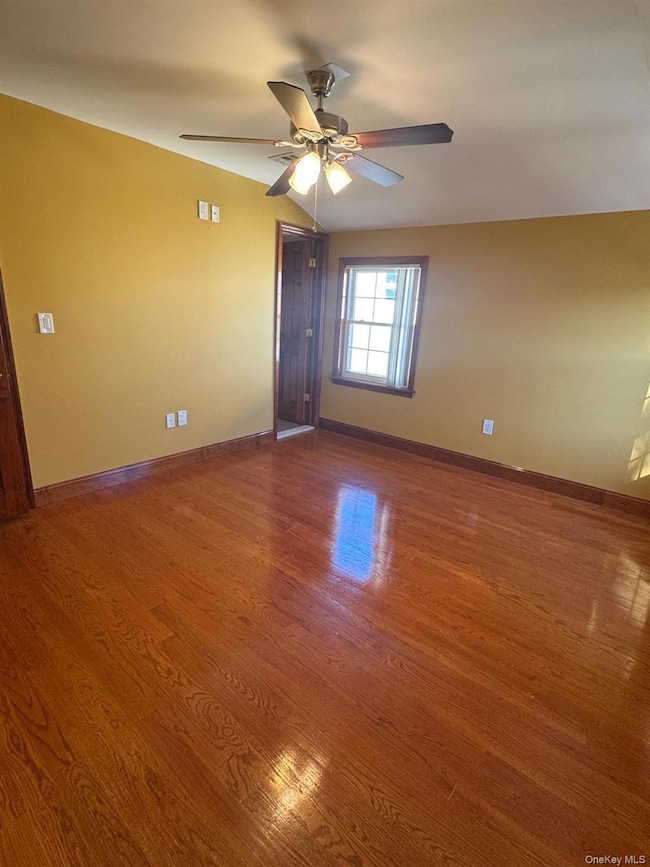
About This Home
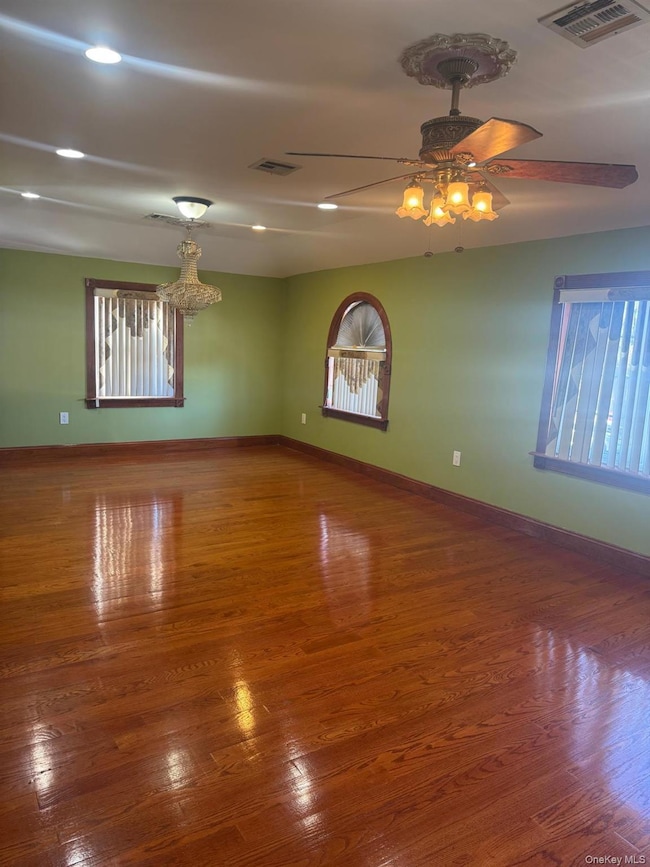
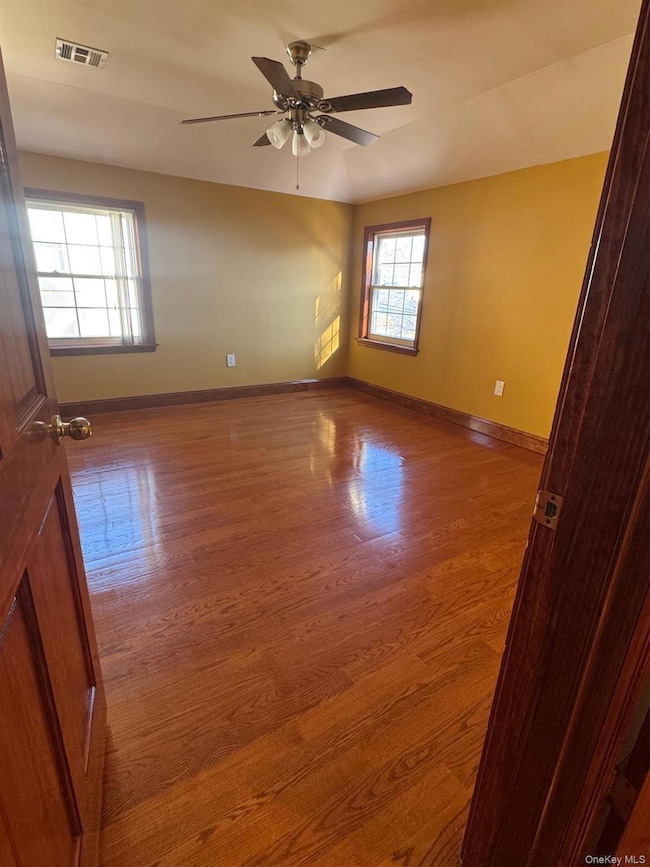
Welcome home to this beautifully renovated second-floor residence in the highly desirable Glen Oaks Queens community, located within the sought-after District 26 school zone. This spacious 3-bedroom, 2-bath apartment offers a perfect blend of modern comfort and everyday convenience. Step inside to find a granite kitchen equipped with sleek stainless-steel appliances, complemented by rich hardwood floors that flow throughout the home. Both full bathrooms have been tastefully updated, providing a clean and contemporary feel. Ideally situated near local shops, transportation, parks, and top-rated schools, this home delivers exceptional value and an unbeatable location—ready for you to move right
Listing Agent
NEXTHOME PLATINUM PROPERTIES Brokerage Phone: 888-868-6985 License #10491209750 Listed on: 11/30/2025

Co-Listing Agent
NEXTHOME PLATINUM PROPERTIES Brokerage Phone: 888-868-6985 License #10401393268
Property Details
Home Type
- Multi-Family
Est. Annual Taxes
- $5,785
Year Built
- Built in 1940
Parking
- On-Street Parking
Home Design
- 2,387 Sq Ft Home
- Duplex
- Colonial Architecture
- Entry on the 2nd floor
- Brick Exterior Construction
Kitchen
- Gas Oven
- Gas Cooktop
- Dishwasher
- Granite Countertops
Bedrooms and Bathrooms
- 3 Bedrooms
- 2 Full Bathrooms
Schools
- Ps 18 Winchester Elementary School
- Irwin Altman Middle School 172
- Martin Van Buren High School
Additional Features
- 4,000 Sq Ft Lot
- Forced Air Heating and Cooling System
Community Details
- Pets Allowed
Listing and Financial Details
- 12-Month Minimum Lease Term
- Assessor Parcel Number 07958-0020
Map
Source: OneKey® MLS
MLS Number: 939762
APN: 07958-0020
Disclaimer: Certain information contained herein is derived from information provided by parties other than Homes.com. All information provided is deemed reliable, but is not guaranteed to be accurate and should be independently verified.
![]() The data relating to real estate for sale or lease on this web site comes in part from OneKey® MLS. Real estate listings held by brokerage firms other than Ten-X are marked with the OneKey® MLS logo or an abbreviated logo and detailed information about them includes the name of the listing broker.
The data relating to real estate for sale or lease on this web site comes in part from OneKey® MLS. Real estate listings held by brokerage firms other than Ten-X are marked with the OneKey® MLS logo or an abbreviated logo and detailed information about them includes the name of the listing broker.
IDX information is provided exclusively for personal, non-commercial use, and may not be used for any purpose other than to identify prospective properties consumers may be interested in purchasing.
Information is deemed reliable but not guaranteed.
Copyright 2025 OneKey® MLS. All rights reserved.
- 23913 86th Ave
- 241-10 86th Ave
- 24134 87th Ave
- 83-27 Commonwealth Blvd
- 24612 86th Rd
- 24607 87th Ave
- 8344 247th St
- 246-31 87th Ave
- 84-17 247th St
- 8860 240th St
- 246-59 86th Rd
- 83-17 247th St
- 83-46 248th St
- 87-01 Commonwealth Blvd
- 246-62 87th Ave
- 88-19 247th St
- 8918 239th St
- 81-27 242nd St
- 84-25 249th St
- 8933 238th St
- 85-19-8239 239th St
- 8518 241st St Unit 2nd Floor
- 81-52-81242 242nd St
- 8640 235th Ct Unit 2nd floor
- 8825 Lyman St
- 87-30 Commonwealth Blvd Unit 1st Floor
- 238-05 Braddock Ave Unit 2
- 8817 Ransom St Unit 3rd Floor
- 8933 Moline St
- 89-32 Pontiac St
- 8932 Pontiac St
- 80-42 243rd St
- 84-36-8252 252nd St
- 246-17 Unit#A Union Turnpike
- 247-77 Jericho Turnpike Unit 2 FL
- 8901 249th St
- 25208 82nd Ave
- 224-05 93rd Ave
- 9526 243rd St Unit 2nd Floor
- 8611 256th St