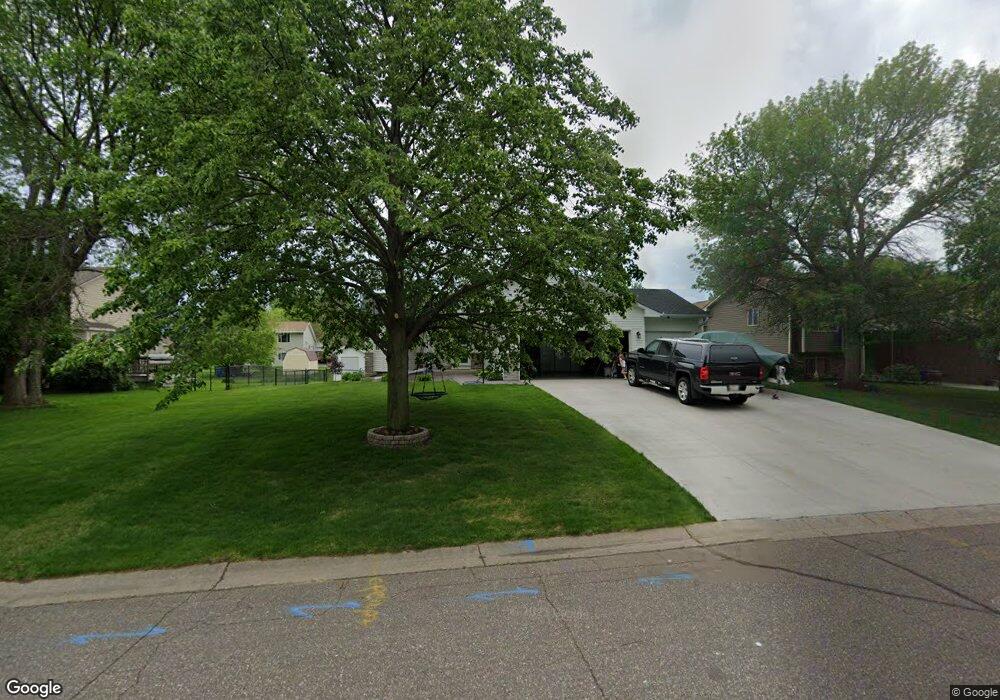
852 114th Ln NE Minneapolis, MN 55434
Estimated Value: $379,000 - $412,497
3
Beds
2
Baths
1,120
Sq Ft
$353/Sq Ft
Est. Value
About This Home
This home is located at 852 114th Ln NE, Minneapolis, MN 55434 and is currently estimated at $395,374, approximately $353 per square foot. 852 114th Ln NE is a home located in Anoka County with nearby schools including Jefferson Elementary School, Northdale Middle School, and Blaine Senior High School.
Ownership History
Date
Name
Owned For
Owner Type
Purchase Details
Closed on
Jun 18, 2018
Sold by
Sinnott Barbara A and Sinnott James R
Bought by
Bak Todd and Bak Alissa J
Current Estimated Value
Home Financials for this Owner
Home Financials are based on the most recent Mortgage that was taken out on this home.
Original Mortgage
$266,000
Outstanding Balance
$230,560
Interest Rate
4.6%
Mortgage Type
New Conventional
Estimated Equity
$164,814
Purchase Details
Closed on
Dec 30, 2005
Sold by
Rue Randal and Rue Cristine
Bought by
Sinnott James R
Purchase Details
Closed on
Jan 31, 1997
Sold by
Swift Construction Inc
Bought by
Rue Randal L and Rue Cristine M
Purchase Details
Closed on
Jan 30, 1997
Sold by
544 Special Llp
Bought by
Swift Construction Inc
Purchase Details
Closed on
Oct 15, 1996
Sold by
North Suburban Development Inc
Bought by
544 Special Llp
Create a Home Valuation Report for This Property
The Home Valuation Report is an in-depth analysis detailing your home's value as well as a comparison with similar homes in the area
Home Values in the Area
Average Home Value in this Area
Purchase History
| Date | Buyer | Sale Price | Title Company |
|---|---|---|---|
| Bak Todd | $280,000 | Trademark Title Services Inc | |
| Sinnott James R | $269,000 | -- | |
| Rue Randal L | $123,200 | -- | |
| Swift Construction Inc | $30,000 | -- | |
| 544 Special Llp | $102,000 | -- |
Source: Public Records
Mortgage History
| Date | Status | Borrower | Loan Amount |
|---|---|---|---|
| Open | Bak Todd | $266,000 | |
| Closed | 544 Special Llp | -- |
Source: Public Records
Tax History Compared to Growth
Tax History
| Year | Tax Paid | Tax Assessment Tax Assessment Total Assessment is a certain percentage of the fair market value that is determined by local assessors to be the total taxable value of land and additions on the property. | Land | Improvement |
|---|---|---|---|---|
| 2025 | $3,933 | $380,800 | $110,000 | $270,800 |
| 2024 | $3,933 | $376,500 | $108,200 | $268,300 |
| 2023 | $3,566 | $376,700 | $103,000 | $273,700 |
| 2022 | $3,235 | $374,100 | $90,000 | $284,100 |
| 2021 | $3,188 | $303,800 | $75,000 | $228,800 |
| 2020 | $2,847 | $293,200 | $75,000 | $218,200 |
| 2019 | $2,460 | $255,300 | $67,000 | $188,300 |
| 2018 | $2,439 | $219,200 | $0 | $0 |
| 2017 | $2,154 | $212,700 | $0 | $0 |
| 2016 | $2,243 | $192,700 | $0 | $0 |
| 2015 | $2,449 | $192,700 | $64,700 | $128,000 |
| 2014 | -- | $176,700 | $52,000 | $124,700 |
Source: Public Records
Map
Nearby Homes
- 11501 Quincy St NE
- 866 113th Ln NE
- 961 113th Ave NE
- 11500 Monroe St NE
- 11676 Able St NE
- 11683 Polk St NE
- 11429 Pierce St NE
- XXX Pierce Ct NE
- 11213 Fillmore St NE
- 11365 Pierce St NE
- 11737 Able St NE
- 11150 Jefferson St NE
- 11741 Fillmore St NE
- 11119 Jefferson St NE
- 11038 Polk St NE
- 612 111th Ave NE
- 11419 6th Place NE Unit 249
- 11407 6th Place NE Unit 246
- 11765 Jefferson St NE
- 11355 6th Place NE Unit 241
- 840 114th Ln NE
- 864 114th Ln NE
- 876 114th Ln NE
- 828 114th Ln NE
- 851 114th Ave NE
- 839 114th Ave NE
- 857 114th Ln NE
- 845 114th Ln NE
- 863 114th Ave NE
- 869 114th Ln NE
- 827 114th Ave NE
- 833 114th Ln NE
- 875 114th Ave NE
- 881 114th Ln NE
- 11436 Tyler St NE
- 11420 Tyler St NE
- 821 114th Ln NE
- 11404 Tyler St NE
- 893 114th Ln NE
- 11444 Van Buren St NE