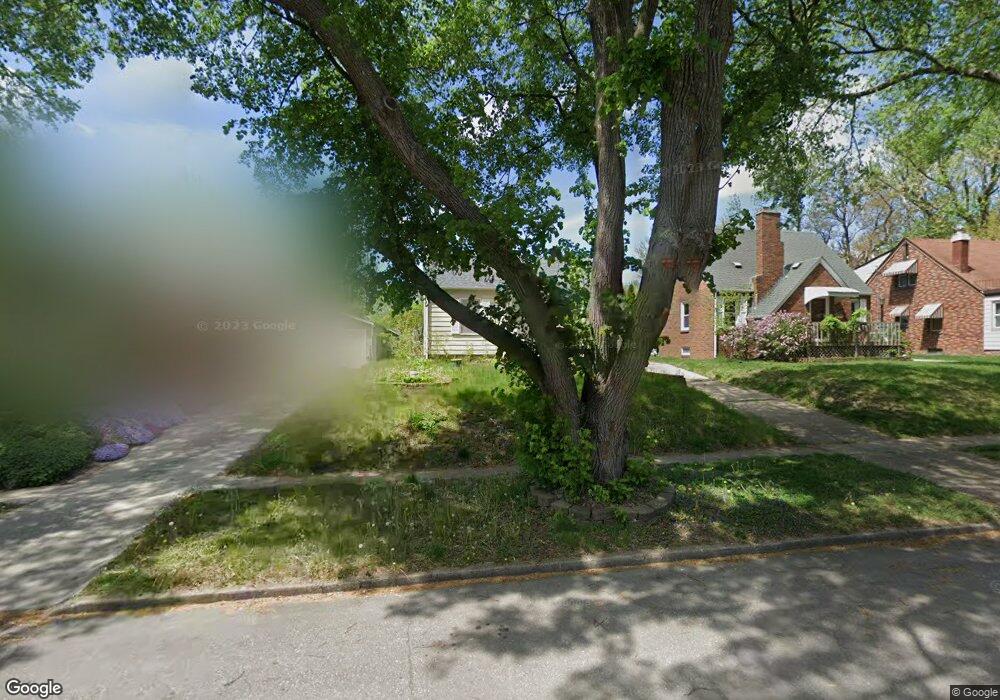
852 40th Place Des Moines, IA 50312
Drake NeighborhoodEstimated Value: $160,140 - $224,000
2
Beds
1
Bath
728
Sq Ft
$247/Sq Ft
Est. Value
About This Home
This home is located at 852 40th Place, Des Moines, IA 50312 and is currently estimated at $179,785, approximately $246 per square foot. 852 40th Place is a home located in Polk County with nearby schools including Hubbell Elementary, Roosevelt High School, and St Augustin Catholic School.
Ownership History
Date
Name
Owned For
Owner Type
Purchase Details
Closed on
Jul 17, 2023
Sold by
Schneider Cathy L and Schneider John D
Bought by
Kirkpatrick Cathy L and Kirkpatrick John D
Current Estimated Value
Purchase Details
Closed on
Oct 19, 1999
Sold by
Mitchell Lonny P and Mitchell Amy K
Bought by
Schneider Cathy L
Purchase Details
Closed on
Oct 22, 1998
Sold by
Anderson Karen L Kennedy
Bought by
Mitchell Lonny P and Skaggs Amy K
Home Financials for this Owner
Home Financials are based on the most recent Mortgage that was taken out on this home.
Original Mortgage
$69,682
Interest Rate
6.88%
Mortgage Type
FHA
Create a Home Valuation Report for This Property
The Home Valuation Report is an in-depth analysis detailing your home's value as well as a comparison with similar homes in the area
Home Values in the Area
Average Home Value in this Area
Purchase History
| Date | Buyer | Sale Price | Title Company |
|---|---|---|---|
| Kirkpatrick Cathy L | -- | None Listed On Document | |
| Schneider Cathy L | $73,000 | -- | |
| Mitchell Lonny P | $69,500 | -- |
Source: Public Records
Mortgage History
| Date | Status | Borrower | Loan Amount |
|---|---|---|---|
| Previous Owner | Mitchell Lonny P | $69,682 |
Source: Public Records
Tax History Compared to Growth
Tax History
| Year | Tax Paid | Tax Assessment Tax Assessment Total Assessment is a certain percentage of the fair market value that is determined by local assessors to be the total taxable value of land and additions on the property. | Land | Improvement |
|---|---|---|---|---|
| 2025 | $2,502 | $152,000 | $49,100 | $102,900 |
| 2024 | $2,502 | $137,600 | $44,400 | $93,200 |
| 2023 | $2,596 | $137,600 | $44,400 | $93,200 |
| 2022 | $2,574 | $119,000 | $39,000 | $80,000 |
| 2021 | $2,444 | $119,000 | $39,000 | $80,000 |
| 2020 | $2,532 | $106,500 | $35,200 | $71,300 |
| 2019 | $2,290 | $106,500 | $35,200 | $71,300 |
| 2018 | $2,260 | $93,700 | $30,500 | $63,200 |
| 2017 | $2,080 | $93,700 | $30,500 | $63,200 |
| 2016 | $2,020 | $85,400 | $27,800 | $57,600 |
| 2015 | $2,020 | $85,400 | $27,800 | $57,600 |
| 2014 | $1,936 | $81,600 | $26,400 | $55,200 |
Source: Public Records
Map
Nearby Homes
- 870 39th St
- 1008 Kingman Cir
- 1001 42nd St
- 1005 38th St
- 4200 Kingman Blvd
- 4036 Plainview Dr
- 4303 Crocker St
- 725 40th St
- 744 37th St
- 4012 Pleasant St
- 3908 Pleasant St
- 1070 37th St
- 689 42nd St
- 3525 Center St
- 1021 45th St
- 4000 University Ave Unit 7
- 3406 School St
- 1206 39th St
- 3821 University Ave
- 708 35th St