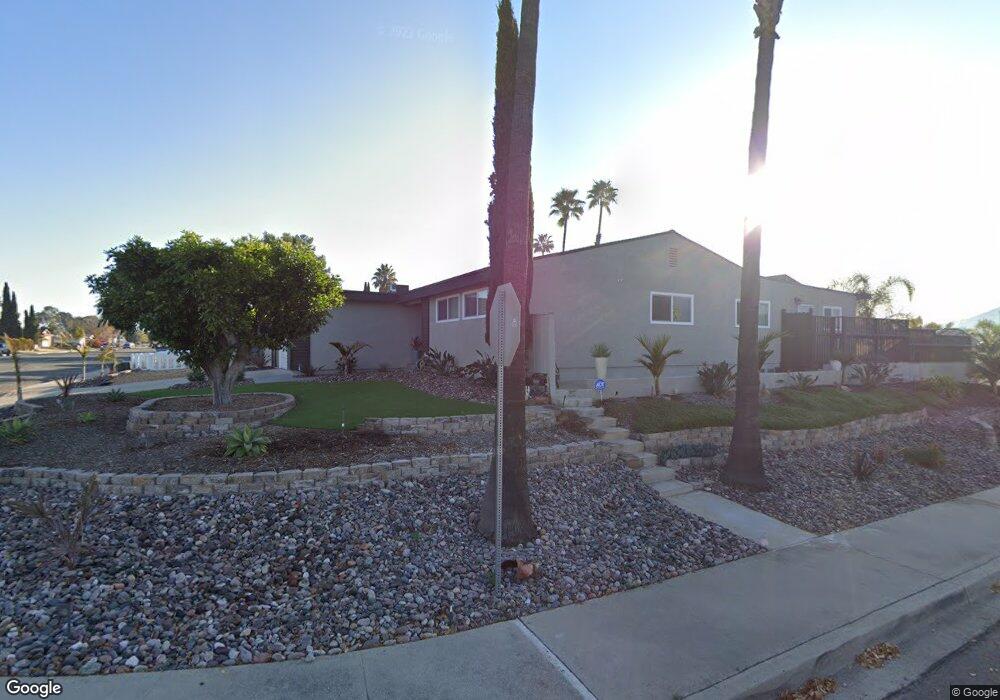
8521 Carlton Oaks Dr Santee, CA 92071
East Elliott NeighborhoodEstimated Value: $932,000 - $1,136,000
4
Beds
4
Baths
1,871
Sq Ft
$530/Sq Ft
Est. Value
About This Home
This home is located at 8521 Carlton Oaks Dr, Santee, CA 92071 and is currently estimated at $992,055, approximately $530 per square foot. 8521 Carlton Oaks Dr is a home located in San Diego County with nearby schools including Carlton Oaks Elementary School and West Hills High School.
Ownership History
Date
Name
Owned For
Owner Type
Purchase Details
Closed on
Mar 16, 2022
Sold by
Brombach Jens S and Brombach Candyce E
Bought by
Brombach Family Trust
Current Estimated Value
Purchase Details
Closed on
Jan 23, 2019
Sold by
Ballinter Group Llc
Bought by
Brombach Jens S and Brombach Candyce E
Home Financials for this Owner
Home Financials are based on the most recent Mortgage that was taken out on this home.
Original Mortgage
$609,482
Interest Rate
5.5%
Mortgage Type
FHA
Purchase Details
Closed on
Sep 6, 2018
Sold by
Nowell Julia and The Kanda Trust Under Declarat
Bought by
Ballinteer Group Llc
Home Financials for this Owner
Home Financials are based on the most recent Mortgage that was taken out on this home.
Original Mortgage
$380,000
Interest Rate
4.5%
Mortgage Type
Commercial
Purchase Details
Closed on
Sep 23, 1994
Sold by
Hudson William K
Bought by
Hudson William Keith
Create a Home Valuation Report for This Property
The Home Valuation Report is an in-depth analysis detailing your home's value as well as a comparison with similar homes in the area
Home Values in the Area
Average Home Value in this Area
Purchase History
| Date | Buyer | Sale Price | Title Company |
|---|---|---|---|
| Brombach Family Trust | -- | Mark Ignacio Law Apc | |
| Brombach Jens S | $649,000 | Lawyers Title Company | |
| Ballinteer Group Llc | $475,000 | First American Title Insuran | |
| Hudson William Keith | -- | First American Title Insuran | |
| Hudson William Keith | -- | -- |
Source: Public Records
Mortgage History
| Date | Status | Borrower | Loan Amount |
|---|---|---|---|
| Previous Owner | Brombach Jens S | $609,482 | |
| Previous Owner | Ballinteer Group Llc | $380,000 |
Source: Public Records
Tax History
| Year | Tax Paid | Tax Assessment Tax Assessment Total Assessment is a certain percentage of the fair market value that is determined by local assessors to be the total taxable value of land and additions on the property. | Land | Improvement |
|---|---|---|---|---|
| 2025 | $8,467 | $723,966 | $183,310 | $540,656 |
| 2024 | $8,467 | $709,771 | $179,716 | $530,055 |
| 2023 | $8,207 | $695,855 | $176,193 | $519,662 |
| 2022 | $8,149 | $668,836 | $169,352 | $499,484 |
| 2021 | $8,037 | $668,836 | $169,352 | $499,484 |
| 2020 | $7,937 | $661,979 | $167,616 | $494,363 |
| 2019 | $5,702 | $475,000 | $120,272 | $354,728 |
| 2018 | $753 | $59,237 | $14,999 | $44,238 |
| 2017 | $741 | $58,076 | $14,705 | $43,371 |
| 2016 | $718 | $56,938 | $14,417 | $42,521 |
| 2015 | $708 | $56,084 | $14,201 | $41,883 |
| 2014 | $694 | $54,986 | $13,923 | $41,063 |
Source: Public Records
Map
Nearby Homes
- 9139 Inverness Rd
- 9219 Inverness Rd
- 8427 Amino Dr
- 8069 Mission George Rd Unit 1
- 8301 Mission Gorge Rd Unit 286
- 8301 Mission Gorge Rd Unit 32
- 8301 Mission Gorge Rd Unit 322
- 8301 Mission Gorge Rd Unit 169
- 8301 Mission Gorge Rd
- 8301 Mission Gorge Rd Unit 253
- 8301 Mission Gorge Rd Unit 248
- 8301 Mission Gorge Rd Unit 208
- 8301 Mission Gorge Rd Unit 331
- 64 Via Sovana
- 60 Via Sovana
- 34 Via Sovana
- 8612 Arminda Cir Unit 51
- 7967 Arly Ct Unit 24
- 19 Carribean Way
- 8545 Mission Gorge Rd Unit 147
- 8525 Carlton Oaks Dr
- 9247 Allano Way
- 8527 Carlton Oaks Dr
- 9238 Pine Valley Dr
- 9250 Allano Way
- 9241 Allano Way
- 9236 Pine Valley Dr
- 9246 Allano Way
- 8522 Carlton Oaks Dr
- 8518 Carlton Oaks Dr
- 8524 Carlton Oaks Dr
- 8514 Carlton Oaks Dr
- 9235 Allano Way
- 8526 Carlton Oaks Dr
- 9240 Allano Way
- 9234 Pine Valley Dr
- 9261 Massot Ave
- 8529 Carlton Oaks Dr
- 9257 Massot Ave
- 8510 Carlton Oaks Dr