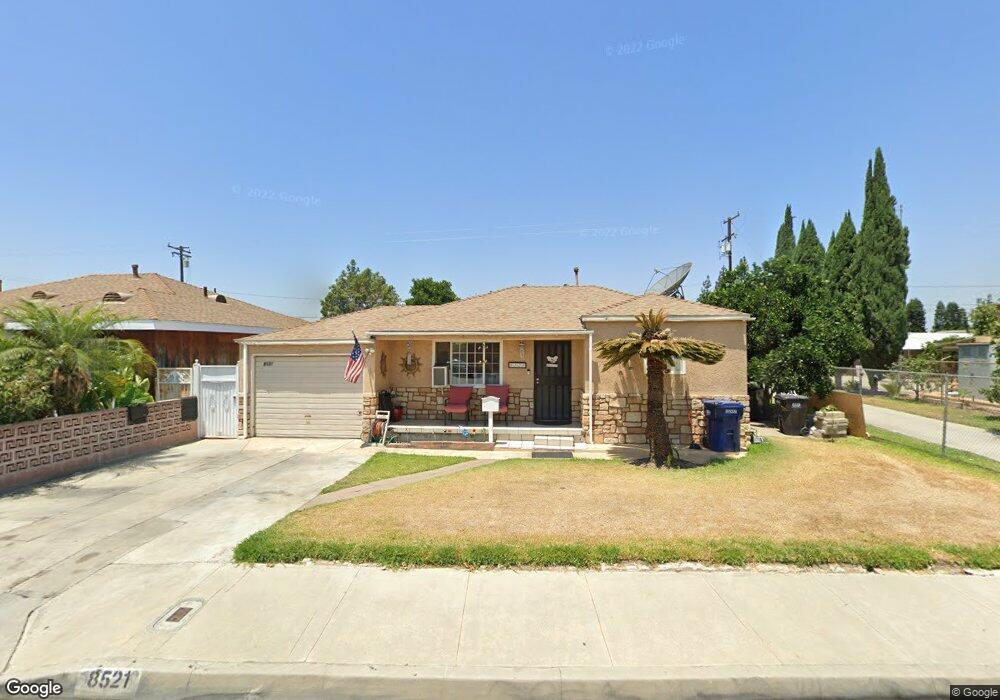
8521 Ceylon Ave Pico Rivera, CA 90660
Estimated Value: $642,000 - $742,000
2
Beds
1
Bath
793
Sq Ft
$862/Sq Ft
Est. Value
About This Home
This home is located at 8521 Ceylon Ave, Pico Rivera, CA 90660 and is currently estimated at $683,909, approximately $862 per square foot. 8521 Ceylon Ave is a home located in Los Angeles County with nearby schools including Magee Academy of Arts & Sciences, The STEAM Academy @ Burke, and El Rancho High School.
Ownership History
Date
Name
Owned For
Owner Type
Purchase Details
Closed on
Aug 5, 2020
Sold by
Vega Sal Vador Lara and Lara Graciela G
Bought by
Vega Salvador Lara and Lara Graciela G
Current Estimated Value
Home Financials for this Owner
Home Financials are based on the most recent Mortgage that was taken out on this home.
Original Mortgage
$86,300
Outstanding Balance
$76,267
Interest Rate
2.8%
Mortgage Type
New Conventional
Estimated Equity
$607,642
Purchase Details
Closed on
Dec 13, 2002
Sold by
Chavez Darlene
Bought by
Lara Salvador
Home Financials for this Owner
Home Financials are based on the most recent Mortgage that was taken out on this home.
Original Mortgage
$140,000
Interest Rate
6.03%
Purchase Details
Closed on
May 3, 1995
Sold by
Holmes Mary A
Bought by
Lara Salvador
Home Financials for this Owner
Home Financials are based on the most recent Mortgage that was taken out on this home.
Original Mortgage
$131,100
Interest Rate
7.62%
Create a Home Valuation Report for This Property
The Home Valuation Report is an in-depth analysis detailing your home's value as well as a comparison with similar homes in the area
Home Values in the Area
Average Home Value in this Area
Purchase History
| Date | Buyer | Sale Price | Title Company |
|---|---|---|---|
| Vega Salvador Lara | -- | Pacific Coast Title Company | |
| Lara Salvador | -- | Commonwealth | |
| Lara Salvador | $138,000 | Southland Title Corporation |
Source: Public Records
Mortgage History
| Date | Status | Borrower | Loan Amount |
|---|---|---|---|
| Open | Vega Salvador Lara | $86,300 | |
| Closed | Lara Salvador | $140,000 | |
| Previous Owner | Lara Salvador | $131,100 |
Source: Public Records
Tax History
| Year | Tax Paid | Tax Assessment Tax Assessment Total Assessment is a certain percentage of the fair market value that is determined by local assessors to be the total taxable value of land and additions on the property. | Land | Improvement |
|---|---|---|---|---|
| 2025 | $3,702 | $239,942 | $170,749 | $69,193 |
| 2024 | $3,702 | $235,238 | $167,401 | $67,837 |
| 2023 | $3,600 | $230,626 | $164,119 | $66,507 |
| 2022 | $3,441 | $226,104 | $160,901 | $65,203 |
| 2021 | $3,337 | $221,672 | $157,747 | $63,925 |
| 2019 | $3,307 | $215,099 | $153,069 | $62,030 |
| 2018 | $3,097 | $210,882 | $150,068 | $60,814 |
| 2016 | $2,806 | $202,695 | $144,242 | $58,453 |
| 2015 | $2,764 | $199,651 | $142,076 | $57,575 |
| 2014 | $2,733 | $195,741 | $139,293 | $56,448 |
Source: Public Records
Map
Nearby Homes
- 8414 Cravell Ave
- 8901 Serapis Ave Unit 25
- 8551 Eglise Ave
- 8611 Eglise Ave
- 8328 Buhman Ave
- 8104 Arrington Ave
- 8806 Stamps Rd
- 9602 Florpark St
- 9515 Shade Ln
- 9069 Gallatin Rd
- 8320 Orange Ave
- 8604 Whittle Ct
- 9734 Terradell St
- 9225 Sideview Dr
- 9273 Sierra Vista Cir
- 9145 Raviller Dr
- 9246 Manzanar Ave
- 8906 Brock Ave
- 7354 Diamond Dr
- 9440 Gallatin Rd
- 8519 Ceylon Ave
- 8527 Ceylon Ave
- 8533 Ceylon Ave
- 8515 Ceylon Ave
- 8537 Ceylon Ave
- 8509 Ceylon Ave
- 8522 Ceylon Ave
- 8518 Ceylon Ave
- 8528 Ceylon Ave
- 8522 Serapis Ave
- 8526 Serapis Ave
- 8512 Ceylon Ave
- 8516 Serapis Ave
- 8532 Serapis Ave
- 8532 Ceylon Ave
- 8543 Ceylon Ave
- 8503 Ceylon Ave
- 8508 Ceylon Ave
- 8512 Serapis Ave
- 8538 Serapis Ave
Your Personal Tour Guide
Ask me questions while you tour the home.