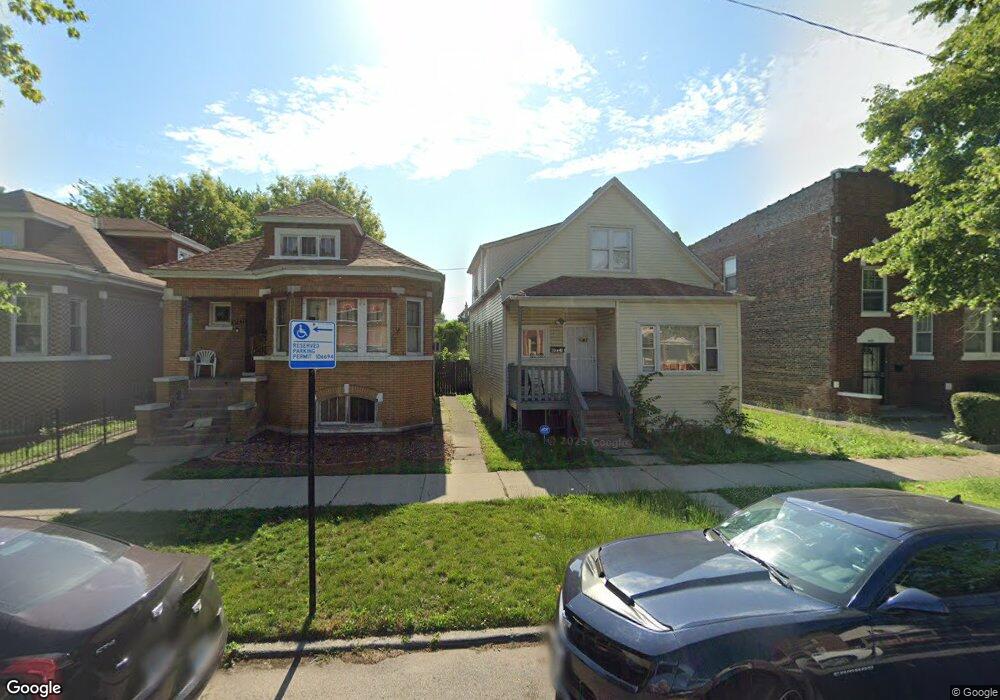
8527 S Oglesby Ave Chicago, IL 60617
South Chicago NeighborhoodEstimated Value: $136,000 - $240,000
6
Beds
2
Baths
814
Sq Ft
$225/Sq Ft
Est. Value
About This Home
This home is located at 8527 S Oglesby Ave, Chicago, IL 60617 and is currently estimated at $183,162, approximately $225 per square foot. 8527 S Oglesby Ave is a home located in Cook County with nearby schools including Coles Elementary Language Academy, Great Lakes Academy, and Noble - Baker College Preparatory High School.
Ownership History
Date
Name
Owned For
Owner Type
Purchase Details
Closed on
Nov 2, 2011
Sold by
Continuum Capital Llc
Bought by
Archer Real Estate Partners Llc Series 8
Current Estimated Value
Purchase Details
Closed on
Apr 28, 2011
Sold by
U S Bank National Association
Bought by
Continuum Capital Llc
Purchase Details
Closed on
Dec 6, 2010
Sold by
Jones Catherine
Bought by
Us Bank National Association
Purchase Details
Closed on
Nov 24, 2000
Sold by
Duggan William
Bought by
Jones Catherine
Home Financials for this Owner
Home Financials are based on the most recent Mortgage that was taken out on this home.
Original Mortgage
$85,500
Interest Rate
12.9%
Purchase Details
Closed on
Feb 24, 2000
Sold by
Johnson Kyle and Johnson Anthony
Bought by
Duggan William
Purchase Details
Closed on
Oct 18, 1999
Sold by
Wheatley Rhondamarie
Bought by
Johnson Kyle and Johnson Anthony
Create a Home Valuation Report for This Property
The Home Valuation Report is an in-depth analysis detailing your home's value as well as a comparison with similar homes in the area
Home Values in the Area
Average Home Value in this Area
Purchase History
| Date | Buyer | Sale Price | Title Company |
|---|---|---|---|
| Archer Real Estate Partners Llc Series 8 | -- | None Available | |
| Continuum Capital Llc | $17,000 | Premier Title | |
| Us Bank National Association | -- | Premier Title | |
| Jones Catherine | $95,000 | -- | |
| Duggan William | $15,000 | First American Title | |
| Johnson Kyle | -- | First American Title |
Source: Public Records
Mortgage History
| Date | Status | Borrower | Loan Amount |
|---|---|---|---|
| Previous Owner | Jones Catherine | $85,500 |
Source: Public Records
Tax History Compared to Growth
Tax History
| Year | Tax Paid | Tax Assessment Tax Assessment Total Assessment is a certain percentage of the fair market value that is determined by local assessors to be the total taxable value of land and additions on the property. | Land | Improvement |
|---|---|---|---|---|
| 2024 | $1,997 | $8,234 | $3,515 | $4,719 |
| 2023 | $1,243 | $9,467 | $5,859 | $3,608 |
| 2022 | $1,243 | $9,467 | $5,859 | $3,608 |
| 2021 | $1,234 | $9,465 | $5,858 | $3,607 |
| 2020 | $1,198 | $8,481 | $4,218 | $4,263 |
| 2019 | $1,204 | $9,424 | $4,218 | $5,206 |
| 2018 | $1,183 | $9,424 | $4,218 | $5,206 |
| 2017 | $1,097 | $8,470 | $3,749 | $4,721 |
| 2016 | $1,196 | $8,470 | $3,749 | $4,721 |
| 2015 | $1,071 | $8,470 | $3,749 | $4,721 |
| 2014 | $839 | $7,090 | $3,280 | $3,810 |
| 2013 | $811 | $7,090 | $3,280 | $3,810 |
Source: Public Records
Map
Nearby Homes
- 8556 S Yates Blvd
- 8434 S Yates Blvd
- 8439 S Crandon Ave
- 8548 S Essex Ave
- 10 S Phillips Ave
- 8448 S Essex Ave
- 8627 S Essex Ave
- 8645 S Essex Ave
- 8349 S Oglesby Ave
- 8425 S Essex Ave
- 8442 S Kingston Ave
- 8537 S Kingston Ave
- 8338 S Yates Blvd
- 8601 S Kingston Ave
- 8548 S Colfax Ave
- 8647 S Kingston Ave
- 8643 S Kingston Ave
- 8319 S Crandon Ave
- 8747 S Colfax Ave
- 8737 S Essex Ave
- 8523 S Oglesby Ave
- 8531 S Oglesby Ave
- 8519 S Oglesby Ave
- 8533 S Oglesby Ave Unit 2
- 8533 S Oglesby Ave
- 8535 S Oglesby Ave
- 8535 S Oglesby Ave
- 8517 S Oglesby Ave
- 8537 S Oglesby Ave
- 8515 S Oglesby Ave
- 8526 S Yates Blvd
- 8522 S Yates Blvd
- 8530 S Yates Blvd
- 8543 S Oglesby Ave
- 8532 S Yates Blvd
- 8532 S Yates Blvd
- 8518 S Yates Blvd
- 8536 S Yates Blvd
- 8509 S Oglesby Ave
- 8514 S Yates Blvd