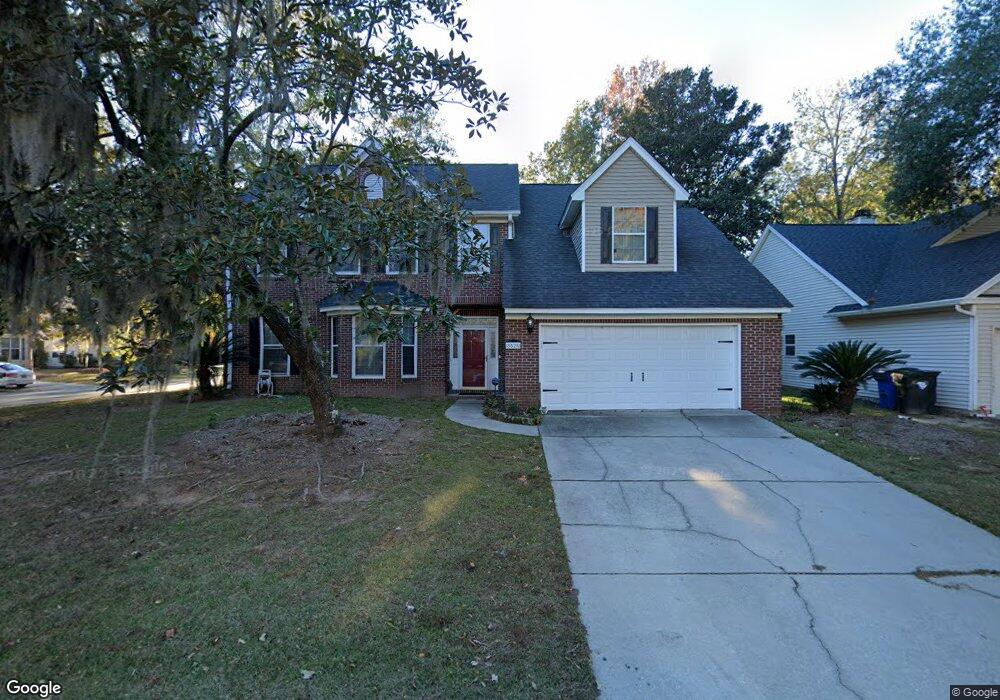
8528 Stonebridge Dr North Charleston, SC 29420
Estimated Value: $420,721 - $456,000
4
Beds
3
Baths
2,180
Sq Ft
$198/Sq Ft
Est. Value
About This Home
This home is located at 8528 Stonebridge Dr, North Charleston, SC 29420 and is currently estimated at $432,430, approximately $198 per square foot. 8528 Stonebridge Dr is a home located in Dorchester County with nearby schools including Eagle Nest Elementary School, River Oaks Middle School, and Fort Dorchester High School.
Ownership History
Date
Name
Owned For
Owner Type
Purchase Details
Closed on
Oct 20, 2006
Sold by
Danigole Mark S and Danigole Patrica A
Bought by
Ponte Cheryl A
Current Estimated Value
Home Financials for this Owner
Home Financials are based on the most recent Mortgage that was taken out on this home.
Original Mortgage
$45,450
Outstanding Balance
$27,035
Interest Rate
6.31%
Mortgage Type
Stand Alone Second
Estimated Equity
$405,395
Purchase Details
Closed on
Jun 10, 2003
Sold by
Meek Clifton S and Meek Necia M
Bought by
Danigole Mark S and Danigole Patricia A
Purchase Details
Closed on
Apr 28, 2000
Sold by
Lyskin Andre V and Lyskin Lana A
Bought by
Meek Clifton Scott and Wheeler Necia Michelle
Purchase Details
Closed on
Jun 14, 1999
Sold by
Va
Bought by
Lyskin Andre
Create a Home Valuation Report for This Property
The Home Valuation Report is an in-depth analysis detailing your home's value as well as a comparison with similar homes in the area
Home Values in the Area
Average Home Value in this Area
Purchase History
| Date | Buyer | Sale Price | Title Company |
|---|---|---|---|
| Ponte Cheryl A | $227,250 | None Available | |
| Danigole Mark S | $195,000 | -- | |
| Meek Clifton Scott | $171,000 | -- | |
| Lyskin Andre | $144,400 | -- |
Source: Public Records
Mortgage History
| Date | Status | Borrower | Loan Amount |
|---|---|---|---|
| Open | Ponte Cheryl A | $45,450 | |
| Open | Ponte Cheryl A | $181,800 |
Source: Public Records
Tax History Compared to Growth
Tax History
| Year | Tax Paid | Tax Assessment Tax Assessment Total Assessment is a certain percentage of the fair market value that is determined by local assessors to be the total taxable value of land and additions on the property. | Land | Improvement |
|---|---|---|---|---|
| 2024 | $2,324 | $13,471 | $5,000 | $8,471 |
| 2023 | $2,324 | $8,048 | $2,800 | $5,248 |
| 2022 | $2,061 | $7,870 | $2,300 | $5,570 |
| 2021 | $2,061 | $7,870 | $2,300 | $5,570 |
| 2020 | $1,979 | $7,868 | $2,300 | $5,568 |
| 2019 | $1,952 | $7,868 | $2,300 | $5,568 |
| 2018 | $1,730 | $6,840 | $2,000 | $4,840 |
| 2017 | $1,673 | $6,840 | $2,000 | $4,840 |
| 2016 | $1,673 | $6,840 | $2,000 | $4,840 |
| 2015 | $1,669 | $6,840 | $2,000 | $4,840 |
| 2014 | $1,920 | $202,500 | $0 | $0 |
| 2013 | -- | $8,100 | $0 | $0 |
Source: Public Records
Map
Nearby Homes
- 5360 Greggs Landing
- 8610 Heatherglen Ct
- 4606 Moss Ct
- 1312 Garland St
- 8464 Athens Way
- 4912 Chartwell Dr
- 8525 Long Meadow Dr
- 0 Dorchester Rd Unit 24030438
- 5343 Tidewater Dr
- 3239 Landing Pkwy
- 4723 Cotillion Dr
- 8522 Long Meadow Dr
- 8620 Coppergrove Dr
- 5488 Altamaha Dr
- 5472 Altamaha Dr
- 8608 Hickory Creek Ln
- 5411 Overland Trail
- 5456 Rising Tide
- 8740 Silver Perch Ln
- 8701 Caspiana Ln
- 8526 Stonebridge Dr
- 8527 Falling Leaf Ln
- 8524 Stonebridge Dr
- 8525 Falling Leaf Ln
- 5396 Greggs Landing
- 5394 Greggs Landing
- 5401 Greggs Landing
- 5396 Greggs Landing Dr
- 5398 Greggs Landing
- 5398 Greggs Landing Unit 1
- 5392 Greggs Landing
- 8523 Falling Leaf Ln
- 5400 Greggs Landing
- 8522 Stonebridge Dr
- 5390 Greggs Landing
- 5403 Greggs Landing Dr
- 5403 Greggs Landing
- 5402 Greggs Landing
- 5402 Greggs Landing Dr
- 8519 Stonebridge Dr