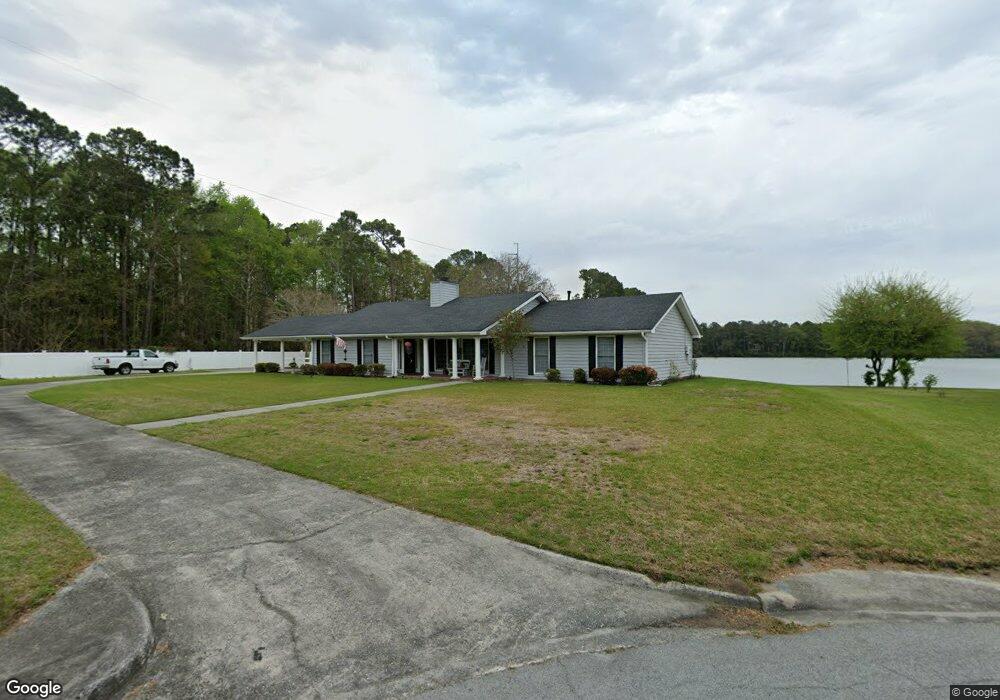
8529 Elmhurst Ct Savannah, GA 31406
Sandfly NeighborhoodEstimated Value: $615,000 - $874,000
4
Beds
3
Baths
3,841
Sq Ft
$196/Sq Ft
Est. Value
About This Home
This home is located at 8529 Elmhurst Ct, Savannah, GA 31406 and is currently estimated at $753,019, approximately $196 per square foot. 8529 Elmhurst Ct is a home located in Chatham County with nearby schools including Isle Of Hope School, Johnson High School, and Oglethorpe Charter School.
Ownership History
Date
Name
Owned For
Owner Type
Purchase Details
Closed on
Mar 24, 2020
Sold by
Green Thomas Gerald
Bought by
Sanders Marion T and Sanders Carmela Harmon
Current Estimated Value
Home Financials for this Owner
Home Financials are based on the most recent Mortgage that was taken out on this home.
Original Mortgage
$300,000
Outstanding Balance
$265,186
Interest Rate
3.4%
Mortgage Type
New Conventional
Estimated Equity
$487,833
Create a Home Valuation Report for This Property
The Home Valuation Report is an in-depth analysis detailing your home's value as well as a comparison with similar homes in the area
Home Values in the Area
Average Home Value in this Area
Purchase History
| Date | Buyer | Sale Price | Title Company |
|---|---|---|---|
| Sanders Marion T | $490,000 | -- |
Source: Public Records
Mortgage History
| Date | Status | Borrower | Loan Amount |
|---|---|---|---|
| Open | Sanders Marion T | $300,000 |
Source: Public Records
Tax History Compared to Growth
Tax History
| Year | Tax Paid | Tax Assessment Tax Assessment Total Assessment is a certain percentage of the fair market value that is determined by local assessors to be the total taxable value of land and additions on the property. | Land | Improvement |
|---|---|---|---|---|
| 2025 | $4,143 | $212,000 | $44,000 | $168,000 |
| 2024 | $4,143 | $215,680 | $44,000 | $171,680 |
| 2023 | $4,606 | $172,480 | $25,960 | $146,520 |
| 2022 | $6,320 | $200,920 | $25,960 | $174,960 |
| 2021 | $8,031 | $177,400 | $25,960 | $151,440 |
| 2020 | $3,099 | $130,120 | $25,960 | $104,160 |
| 2019 | $3,220 | $130,120 | $25,960 | $104,160 |
| 2018 | $2,744 | $128,520 | $25,960 | $102,560 |
| 2017 | $2,695 | $146,520 | $29,520 | $117,000 |
| 2016 | $2,774 | $116,720 | $29,520 | $87,200 |
| 2015 | $2,767 | $118,640 | $29,520 | $89,120 |
| 2014 | $3,992 | $121,880 | $0 | $0 |
Source: Public Records
Map
Nearby Homes
- 17 Tara Ct
- 8621 Ferguson Ave
- 114 Lakeview Ct
- 117 Fox Chase Rd
- 0 Albert St Unit SA337026
- 109 Canter Ct
- 7 Bakers Crossing
- 9143 Ferguson Ave
- 7216 Garfield St
- 4 Cross Bow Ct
- 7206 Garfield St
- 8449 Old Montgomery Rd
- 8519 Cresthill Ave
- 111 S Robinhood Dr
- 59 Romney Place
- 106 Holcomb St
- 7014 Key St
- 113 Gilliam Ave
- 6 Prince Charles Ct
- 8623 W Creighton Place