853 Alford St Glendora, CA 91740
South Glendora NeighborhoodEstimated Value: $686,882 - $776,000
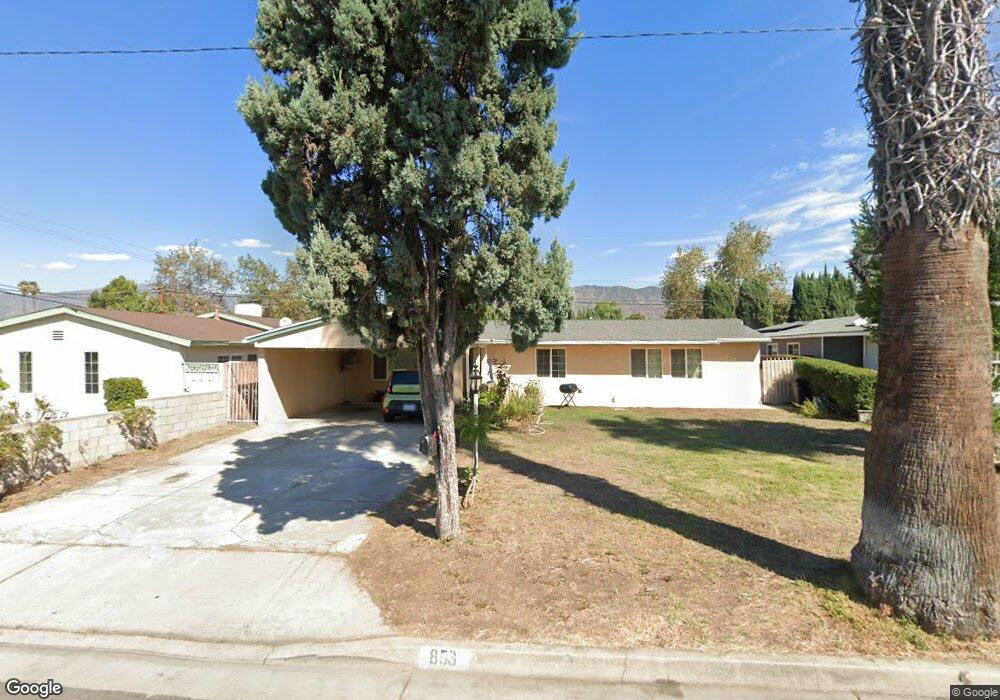
About This Home
This home is located at 853 Alford St, Glendora, CA 91740 and is currently estimated at $740,471, approximately $650 per square foot. 853 Alford St is a home located in Los Angeles County with nearby schools including Azusa High School and Foothill Christian.
Ownership History
We collect this data history from publicly available records. To have your information removed, we recommend requesting removal directly through your county’s website.
Purchase Details
Home Financials for this Owner
Home Financials are based on the most recent Mortgage that was taken out on this home.Home Values in the Area
Average Home Value in this Area
Purchase History
We collect this data history from publicly available records. To have your information removed, we recommend requesting removal directly through your county’s website.
| Date | Buyer | Sale Price | Title Company |
|---|---|---|---|
| $116,000 | Title Land Company Inc |
Mortgage History
We collect this data history from publicly available records. To have your information removed, we recommend requesting removal directly through your county’s website.
| Date | Status | Borrower | Loan Amount |
|---|---|---|---|
| Open | $115,338 |
Tax History
We collect this data history from publicly available records. To have your information removed, we recommend requesting removal directly through your county’s website.
| Year | Tax Paid | Tax Assessment Tax Assessment Total Assessment is a certain percentage of the fair market value that is determined by local assessors to be the total taxable value of land and additions on the property. | Land | Improvement |
|---|---|---|---|---|
| 2025 | $2,756 | $188,894 | $115,459 | $73,435 |
| 2024 | $2,629 | $185,192 | $113,196 | $71,996 |
| 2023 | $2,554 | $181,562 | $110,977 | $70,585 |
| 2022 | $2,520 | $178,002 | $108,801 | $69,201 |
| 2021 | $2,453 | $174,513 | $106,668 | $67,845 |
| 2019 | $2,375 | $169,339 | $103,505 | $65,834 |
| 2018 | $2,239 | $166,020 | $101,476 | $64,544 |
| 2016 | $2,148 | $159,576 | $97,537 | $62,039 |
| 2015 | $2,121 | $157,180 | $96,072 | $61,108 |
| 2014 | $2,002 | $154,102 | $94,191 | $59,911 |
Map
- 6003 N Briargate Ln
- 18811 E Glenlyn Dr
- 1230 S Barranca Ave Unit F
- 1029 E Galatea St
- 19079 E Linfield St
- 6014 N Fairvale Dr
- 1007 E Citrus Edge St
- 5717 N Hanlin Ave
- 962 E Citrus Edge St
- 1356 S Prospero Dr
- 605 W Gaillard St
- 6145 N Fairvale Dr
- 18526 E Petunia St
- 221 S Ranburn Ave
- 1130 E Alosta Ave Unit B102
- 5708 N Viceroy Ave
- 907 E Ghent St
- 5923 N Edenfield Ave
- 5434 N Oakbank Ave
- 1268 S Westridge Ave
- 849 Alford St
- 1022 S Barranca Ave
- 845 Alford St
- 854 Alford St
- 850 Alford St
- 846 Alford St
- 840 Alford St
- 833 Alford St
- 853 W Galatea St
- 849 W Galatea St
- 834 Alford St
- 18899 E Alford St
- 845 W Galatea St
- 827 Alford St
- 839 W Galatea St
- 18881 E Alford St
- 828 Alford St
- 833 W Galatea St
- 821 Alford St
- 18877 E Alford St
Ask me questions while you tour the home.