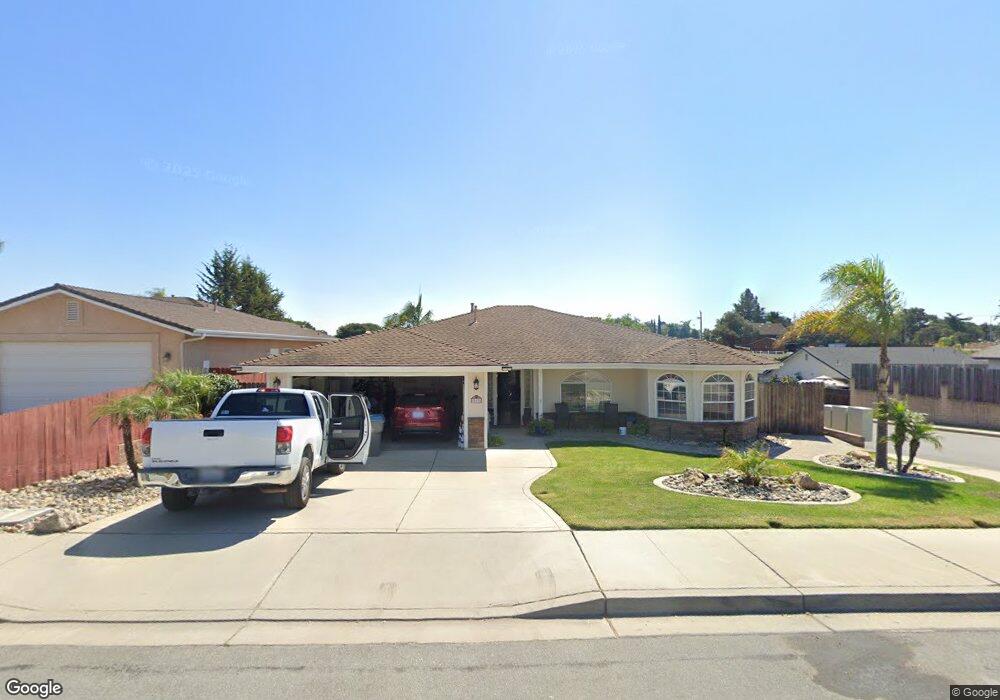
853 Hibiscus Ct Nipomo, CA 93444
Estimated Value: $758,562 - $888,000
3
Beds
2
Baths
1,812
Sq Ft
$454/Sq Ft
Est. Value
About This Home
This home is located at 853 Hibiscus Ct, Nipomo, CA 93444 and is currently estimated at $822,891, approximately $454 per square foot. 853 Hibiscus Ct is a home located in San Luis Obispo County with nearby schools including Dana Elementary School, Mesa Middle School, and Nipomo High School.
Ownership History
Date
Name
Owned For
Owner Type
Purchase Details
Closed on
May 7, 2018
Sold by
Silva Martin J and Silva Brenda M
Bought by
Silva Martin J and Silva Brenda M
Current Estimated Value
Purchase Details
Closed on
Jan 12, 2018
Sold by
Silva Martin J and Silva Brenda M
Bought by
Silva Martin J and Silva Brenda M
Home Financials for this Owner
Home Financials are based on the most recent Mortgage that was taken out on this home.
Original Mortgage
$180,000
Outstanding Balance
$141,942
Interest Rate
3.94%
Mortgage Type
Credit Line Revolving
Estimated Equity
$680,949
Purchase Details
Closed on
Mar 30, 2001
Sold by
Greenwald Sean S and Greenwald Melinda C
Bought by
Silva Martin J and Silva Brenda M
Home Financials for this Owner
Home Financials are based on the most recent Mortgage that was taken out on this home.
Original Mortgage
$263,925
Interest Rate
6.99%
Create a Home Valuation Report for This Property
The Home Valuation Report is an in-depth analysis detailing your home's value as well as a comparison with similar homes in the area
Home Values in the Area
Average Home Value in this Area
Purchase History
| Date | Buyer | Sale Price | Title Company |
|---|---|---|---|
| Silva Martin J | -- | Ticor Title | |
| Silva Martin J | -- | Ticor Title | |
| Silva Martin J | $310,500 | Fidelity National Title Co |
Source: Public Records
Mortgage History
| Date | Status | Borrower | Loan Amount |
|---|---|---|---|
| Open | Silva Martin J | $180,000 | |
| Previous Owner | Silva Martin J | $263,925 |
Source: Public Records
Tax History
| Year | Tax Paid | Tax Assessment Tax Assessment Total Assessment is a certain percentage of the fair market value that is determined by local assessors to be the total taxable value of land and additions on the property. | Land | Improvement |
|---|---|---|---|---|
| 2025 | $4,644 | $458,677 | $132,943 | $325,734 |
| 2024 | $4,590 | $449,685 | $130,337 | $319,348 |
| 2023 | $4,590 | $440,869 | $127,782 | $313,087 |
| 2022 | $4,519 | $432,226 | $125,277 | $306,949 |
| 2021 | $4,509 | $423,752 | $122,821 | $300,931 |
| 2020 | $4,457 | $419,408 | $121,562 | $297,846 |
| 2019 | $4,428 | $411,185 | $119,179 | $292,006 |
| 2018 | $4,374 | $403,124 | $116,843 | $286,281 |
| 2017 | $4,291 | $395,220 | $114,552 | $280,668 |
| 2016 | $4,045 | $387,471 | $112,306 | $275,165 |
| 2015 | $3,986 | $381,652 | $110,620 | $271,032 |
| 2014 | $3,837 | $374,177 | $108,454 | $265,723 |
Source: Public Records
Map
Nearby Homes
- 219 Lema Dr
- 290 Daffodil Ave
- 778 Primrose Ln
- 745 Inga Rd
- 228 Chaparral Ln
- 825 Sandydale Dr
- 719 W Tefft St
- 1010 1012 Upper Los Berros Rd
- 770 & 772 Beverly
- 182 172 E Chestnut
- 959 Vista Verde Ln
- 680 Hill St
- 270 S Tejas Place
- 680 Sweet Donna Place
- 375 Kestrel Way
- 160 San Antonio Ln
- 449 W Tefft St
- 449 W Tefft St Unit 22
- 449 W Tefft St Unit 23
- 449 W Tefft St Unit 13
- 851 Hibiscus Ct
- 240 Daffodil Ave
- 860 Hibiscus Ct
- 0 Daffodil Ave
- 873 Hibiscus Ct
- 852 Hibiscus Ct
- 180 Alyssum Cir
- 230 Daffodil Ave
- 875 Hibiscus Ct
- 844 Hibiscus Ct
- 245 Angle Dr
- 184 Alyssum Cir
- 220 Daffodil Ave
- 270 Daffodil Ave
- 225 Angle Dr
- 848 Hibiscus Ct
- 879 Hibiscus Ct
- 876 Hibiscus Ct
- 194 Alyssum Cir
Your Personal Tour Guide
Ask me questions while you tour the home.