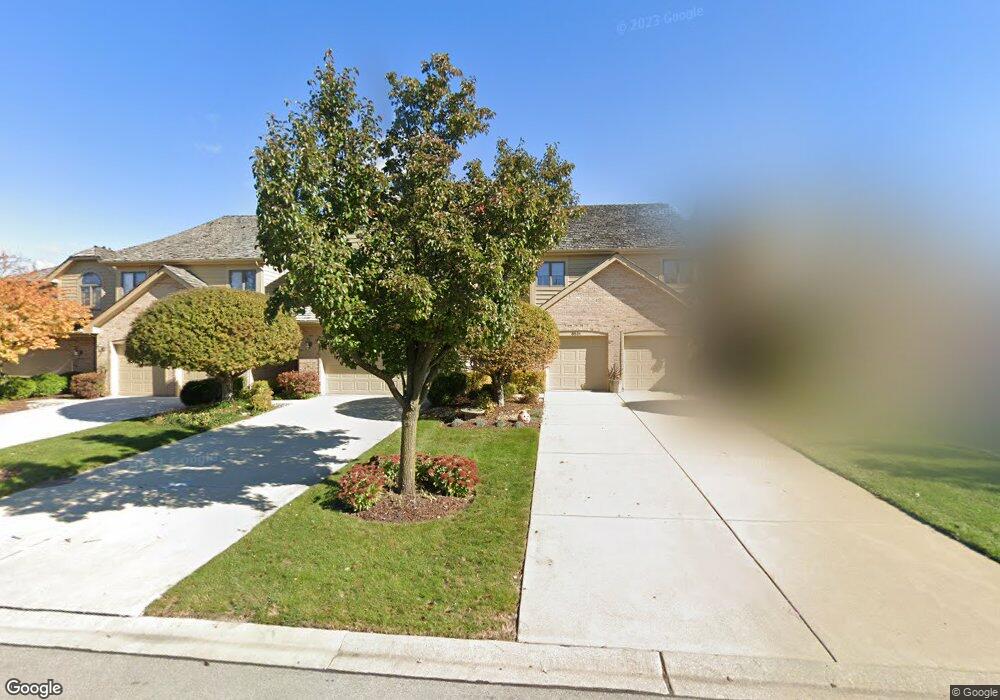
8531 Evergreen Ln Darien, IL 60561
Estimated Value: $442,000 - $534,000
3
Beds
3
Baths
1,843
Sq Ft
$255/Sq Ft
Est. Value
About This Home
This home is located at 8531 Evergreen Ln, Darien, IL 60561 and is currently estimated at $470,251, approximately $255 per square foot. 8531 Evergreen Ln is a home located in DuPage County with nearby schools including Concord Elementary School, Cass Jr High School, and Hinsdale South High School.
Ownership History
Date
Name
Owned For
Owner Type
Purchase Details
Closed on
Jun 30, 1998
Sold by
Martino Angelo A and Martino Kathleen M
Bought by
Young Robert and Young Mary
Current Estimated Value
Purchase Details
Closed on
Jan 25, 1996
Sold by
Bank One Chicago Na
Bought by
Martino Angelo A and Martino Kathleen M
Home Financials for this Owner
Home Financials are based on the most recent Mortgage that was taken out on this home.
Original Mortgage
$191,200
Interest Rate
7.24%
Mortgage Type
Purchase Money Mortgage
Purchase Details
Closed on
Dec 2, 1993
Sold by
Bank Of Lyons
Bought by
Broderick Building Corp
Home Financials for this Owner
Home Financials are based on the most recent Mortgage that was taken out on this home.
Original Mortgage
$185,000
Interest Rate
7.75%
Mortgage Type
Purchase Money Mortgage
Create a Home Valuation Report for This Property
The Home Valuation Report is an in-depth analysis detailing your home's value as well as a comparison with similar homes in the area
Home Values in the Area
Average Home Value in this Area
Purchase History
| Date | Buyer | Sale Price | Title Company |
|---|---|---|---|
| Young Robert | $250,000 | Intercounty Title | |
| Martino Angelo A | $239,000 | 1St American Title | |
| Broderick Building Corp | -- | Chicago Title Insurance Co |
Source: Public Records
Mortgage History
| Date | Status | Borrower | Loan Amount |
|---|---|---|---|
| Previous Owner | Martino Angelo A | $191,200 | |
| Previous Owner | Broderick Building Corp | $185,000 |
Source: Public Records
Tax History Compared to Growth
Tax History
| Year | Tax Paid | Tax Assessment Tax Assessment Total Assessment is a certain percentage of the fair market value that is determined by local assessors to be the total taxable value of land and additions on the property. | Land | Improvement |
|---|---|---|---|---|
| 2024 | $7,414 | $131,048 | $28,305 | $102,743 |
| 2023 | $7,059 | $120,470 | $26,020 | $94,450 |
| 2022 | $7,221 | $119,160 | $25,740 | $93,420 |
| 2021 | $6,699 | $117,810 | $25,450 | $92,360 |
| 2020 | $6,572 | $115,480 | $24,950 | $90,530 |
| 2019 | $6,304 | $110,800 | $23,940 | $86,860 |
| 2018 | $6,349 | $113,640 | $24,550 | $89,090 |
| 2017 | $6,186 | $109,350 | $23,620 | $85,730 |
| 2016 | $6,022 | $104,360 | $22,540 | $81,820 |
| 2015 | $5,878 | $98,190 | $21,210 | $76,980 |
| 2014 | $5,905 | $97,420 | $21,040 | $76,380 |
| 2013 | $5,887 | $99,960 | $21,590 | $78,370 |
Source: Public Records
Map
Nearby Homes
- 1390 Marco Ct
- 1370 Marco Ct
- 8408 Dawn Ln
- 8511 Kearney Rd
- 8122 Ripple Ridge
- 8291 Ripple Ridge
- 7930 Grant St
- 8826 Carlisle Ct
- 1018 Bob-O-link Ln
- 7833 Darien Lake Dr
- 7829 Darien Lake Dr
- 1501 Darien Lake Dr Unit 305
- 500 Redondo Dr Unit 409
- 500 Redondo Dr Unit 308
- 8825 Robert Rd
- 8100 Woodglen Ln Unit 204
- 454 Andrus Rd
- 2221 Donegal Dr
- 502 Redondo Dr Unit 503
- 10S111 Leonard Dr
- 8529 Evergreen Ln
- 8533 Evergreen Ln
- 8527 Evergreen Ln
- 8535 Evergreen Ln
- 8525 Evergreen Ln
- 8601 Evergreen Ln
- 8523 Evergreen Ln
- 8605 Evergreen Ln
- 8530 Evergreen Ln
- 8528 Evergreen Ln
- 8532 Evergreen Ln
- 8521 Evergreen Ln
- 8609 Evergreen Ln
- 8526 Evergreen Ln
- 8534 Evergreen Ln
- 8519 Evergreen Ln
- 8524 Evergreen Ln
- 8613 Evergreen Ln
- 8522 Evergreen Ln
- 8517 Evergreen Ln