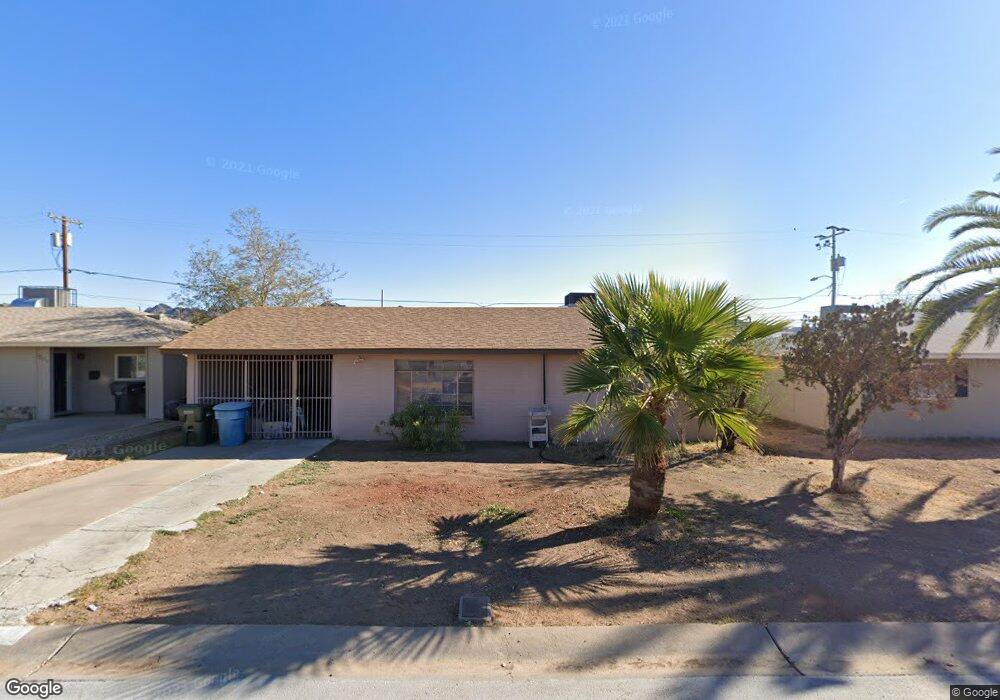
8531 N 6th St Phoenix, AZ 85020
North Central NeighborhoodEstimated Value: $326,523 - $444,000
--
Bed
2
Baths
1,596
Sq Ft
$251/Sq Ft
Est. Value
About This Home
This home is located at 8531 N 6th St, Phoenix, AZ 85020 and is currently estimated at $399,881, approximately $250 per square foot. 8531 N 6th St is a home located in Maricopa County with nearby schools including Desert View Elementary School, Royal Palm Middle School, and Sunnyslope High School.
Ownership History
Date
Name
Owned For
Owner Type
Purchase Details
Closed on
Nov 11, 2010
Sold by
Brockman Lydia
Bought by
Brockman David
Current Estimated Value
Purchase Details
Closed on
Jun 30, 2008
Sold by
Brockman David
Bought by
Brockman David and Brockman Lydia
Purchase Details
Closed on
Apr 30, 2001
Sold by
Brockman Patty
Bought by
Brockman David C
Home Financials for this Owner
Home Financials are based on the most recent Mortgage that was taken out on this home.
Original Mortgage
$80,700
Outstanding Balance
$30,022
Interest Rate
6.98%
Estimated Equity
$369,859
Purchase Details
Closed on
Apr 5, 2000
Sold by
Brockman David C
Bought by
Brockman David C and Brockman Patty
Purchase Details
Closed on
Mar 14, 2000
Sold by
Brockman Patty
Bought by
Brockman David C
Purchase Details
Closed on
Jun 19, 1997
Sold by
Ilie Ioan T and Ilie Marilena
Bought by
Piso Diana and Piso Eugen
Create a Home Valuation Report for This Property
The Home Valuation Report is an in-depth analysis detailing your home's value as well as a comparison with similar homes in the area
Home Values in the Area
Average Home Value in this Area
Purchase History
| Date | Buyer | Sale Price | Title Company |
|---|---|---|---|
| Brockman David | -- | None Available | |
| Brockman David | -- | None Available | |
| Brockman David C | -- | American Title Ins Of Az Inc | |
| Brockman David C | -- | -- | |
| Brockman David C | -- | Nations Title Insurance | |
| Brockman David C | $96,900 | Nations Title Insurance | |
| Piso Diana | -- | -- | |
| Piso Diana | -- | -- |
Source: Public Records
Mortgage History
| Date | Status | Borrower | Loan Amount |
|---|---|---|---|
| Open | Brockman David C | $80,700 |
Source: Public Records
Tax History Compared to Growth
Tax History
| Year | Tax Paid | Tax Assessment Tax Assessment Total Assessment is a certain percentage of the fair market value that is determined by local assessors to be the total taxable value of land and additions on the property. | Land | Improvement |
|---|---|---|---|---|
| 2025 | $1,522 | $13,659 | -- | -- |
| 2024 | $1,435 | $13,008 | -- | -- |
| 2023 | $1,435 | $33,420 | $6,680 | $26,740 |
| 2022 | $1,385 | $24,110 | $4,820 | $19,290 |
| 2021 | $1,419 | $21,520 | $4,300 | $17,220 |
| 2020 | $1,381 | $19,610 | $3,920 | $15,690 |
| 2019 | $1,356 | $17,480 | $3,490 | $13,990 |
| 2018 | $1,318 | $16,730 | $3,340 | $13,390 |
| 2017 | $1,314 | $13,380 | $2,670 | $10,710 |
| 2016 | $1,291 | $12,780 | $2,550 | $10,230 |
| 2015 | $1,197 | $10,930 | $2,180 | $8,750 |
Source: Public Records
Map
Nearby Homes
- 8514 N 8th St
- 801 E Butler Dr
- 304 E Echo Ln
- 8802 N 8th St Unit 102
- 833 E Butler Dr
- 8821 N 7th St Unit 100
- 8821 N 7th St Unit 200
- 8838 N 8th St Unit B12
- 8842 N 8th St Unit 103
- 911 E Ruth Ave
- 214 E Ruth Ave Unit 312
- 8847 N 8th St Unit 205
- 1002 E Butler Dr
- 413 E El Camino Dr
- 1036 E Butler Dr
- 844 E Townley Ave
- 8939 N 8th St
- 8915 N 9th Place
- 8911 N 10th St
- 1130 E Butler Dr Unit E1
- 8527 N 6th St
- 8537 N 6th St
- 8521 N 6th St
- 8541 N 6th St
- 8534 N 6th St
- 8526 N 6th St
- 8517 N 6th St
- 8522 N 6th St
- 536 E Orchid Ln
- 523 E Orchid Ln
- 532 E Orchid Ln
- 8511 N 6th St
- 516 E Butler Dr
- 526 E Orchid Ln
- 517 E Orchid Ln
- 620 E Butler Dr
- 520 E Orchid Ln
- 512 E Butler Dr
- 511 E Orchid Ln
- 523 E Butler Dr