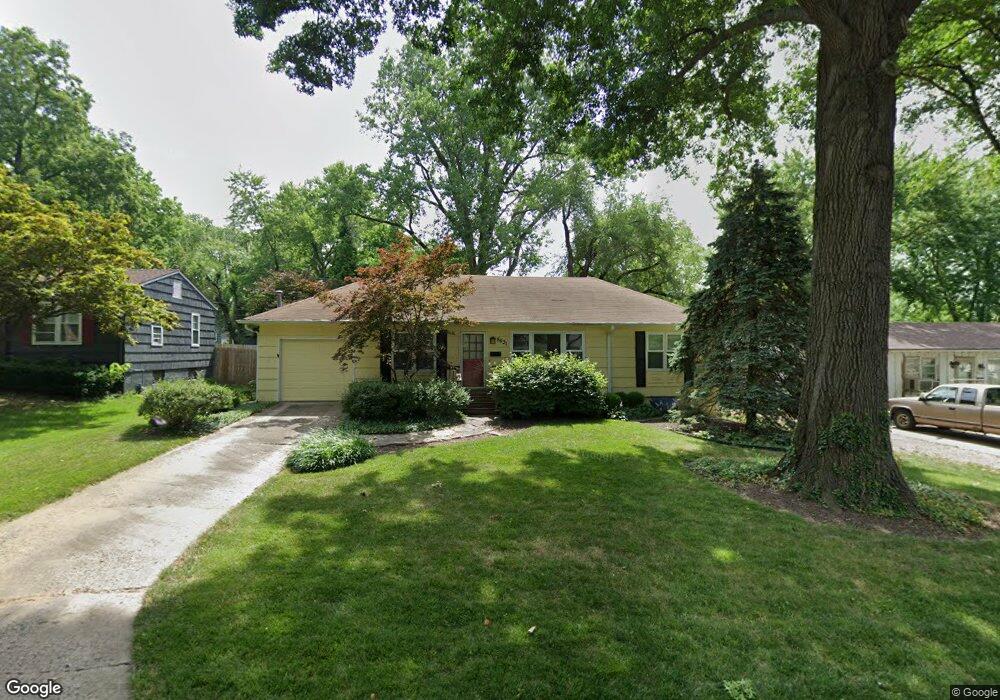
8531 Riggs St Overland Park, KS 66212
Estimated Value: $306,000 - $335,000
3
Beds
2
Baths
1,008
Sq Ft
$318/Sq Ft
Est. Value
About This Home
This home is located at 8531 Riggs St, Overland Park, KS 66212 and is currently estimated at $320,494, approximately $317 per square foot. 8531 Riggs St is a home located in Johnson County with nearby schools including Briarwood Elementary School, Indian Hills Middle School, and Shawnee Mission East High School.
Ownership History
Date
Name
Owned For
Owner Type
Purchase Details
Closed on
Sep 24, 2007
Sold by
Payton Brett D and Payton Tara S
Bought by
Sahadeo Anna and Sahadeo Anna D
Current Estimated Value
Purchase Details
Closed on
Apr 21, 2004
Sold by
Payton Brett D and Payton Tara S
Bought by
Payton Brett D and Payton Tara S
Home Financials for this Owner
Home Financials are based on the most recent Mortgage that was taken out on this home.
Original Mortgage
$137,750
Interest Rate
5.42%
Mortgage Type
New Conventional
Purchase Details
Closed on
Feb 25, 2003
Sold by
Home Rehab Llc
Bought by
Payton Brett D and Conrardy Tara S
Home Financials for this Owner
Home Financials are based on the most recent Mortgage that was taken out on this home.
Original Mortgage
$137,450
Interest Rate
5.86%
Purchase Details
Closed on
Oct 31, 2002
Sold by
Mcclanahan James W
Bought by
Home Rehab Llc
Create a Home Valuation Report for This Property
The Home Valuation Report is an in-depth analysis detailing your home's value as well as a comparison with similar homes in the area
Home Values in the Area
Average Home Value in this Area
Purchase History
| Date | Buyer | Sale Price | Title Company |
|---|---|---|---|
| Sahadeo Anna | -- | Kansas City Title | |
| Payton Brett D | -- | All American Title Company | |
| Payton Brett D | -- | -- | |
| Home Rehab Llc | -- | Chicago Title Insurance Co |
Source: Public Records
Mortgage History
| Date | Status | Borrower | Loan Amount |
|---|---|---|---|
| Previous Owner | Payton Brett D | $137,750 | |
| Previous Owner | Payton Brett D | $137,450 |
Source: Public Records
Tax History Compared to Growth
Tax History
| Year | Tax Paid | Tax Assessment Tax Assessment Total Assessment is a certain percentage of the fair market value that is determined by local assessors to be the total taxable value of land and additions on the property. | Land | Improvement |
|---|---|---|---|---|
| 2024 | $3,142 | $32,856 | $7,152 | $25,704 |
| 2023 | $3,043 | $31,211 | $6,507 | $24,704 |
| 2022 | $2,692 | $27,842 | $6,507 | $21,335 |
| 2021 | $2,492 | $24,426 | $5,204 | $19,222 |
| 2020 | $2,390 | $23,460 | $4,165 | $19,295 |
| 2019 | $2,242 | $22,034 | $3,210 | $18,824 |
| 2018 | $2,106 | $20,620 | $3,210 | $17,410 |
| 2017 | $1,952 | $18,814 | $3,210 | $15,604 |
| 2016 | $1,926 | $18,262 | $3,210 | $15,052 |
| 2015 | $1,775 | $17,204 | $3,210 | $13,994 |
| 2013 | -- | $16,802 | $3,210 | $13,592 |
Source: Public Records
Map
Nearby Homes
- 6725 W 85th Terrace
- 6116 W 85th Terrace
- 6108 W 85th Terrace
- 6201 W 86th Terrace
- 8331 Beverly Dr
- 6655 W 82nd St
- 8204 Tomahawk Rd
- 8231 Travis St
- 8221 Travis St
- 6825 W 82nd St
- 6901 W 82nd St
- 8134 Walmer St
- 6909 W 82nd St
- 8252 Outlook Ln
- 8741 Marty St
- 8326 Maple Ln
- 8330 Riley St
- 8100 Beverly Dr
- 8201 Riley St
- 5516 W 87th Terrace