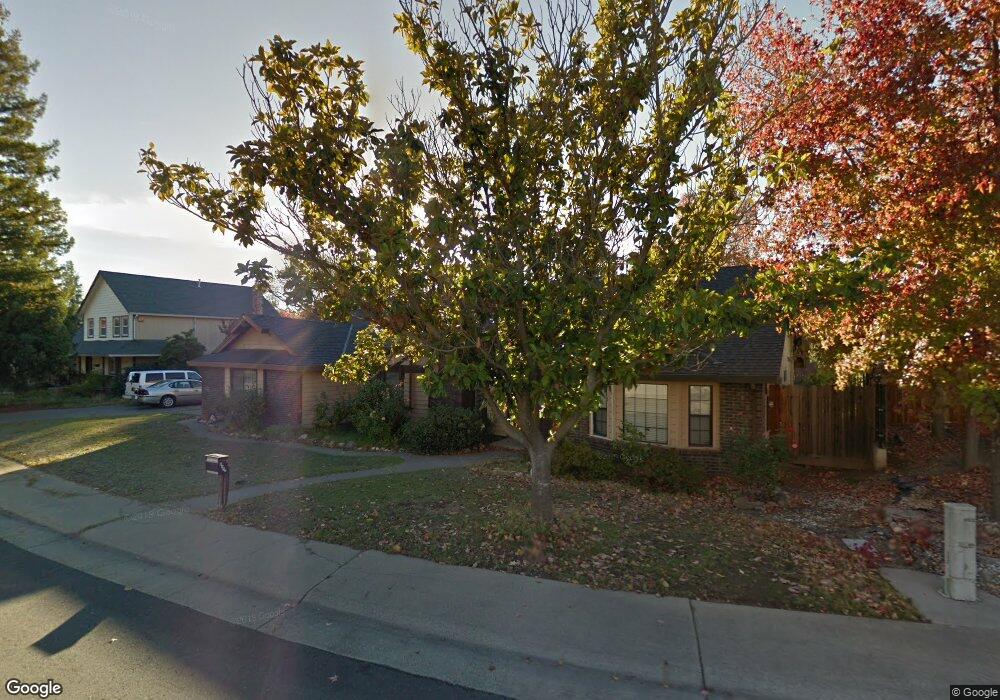
8532 Biruta Ave Orangevale, CA 95662
Estimated Value: $697,240 - $775,000
3
Beds
3
Baths
2,193
Sq Ft
$341/Sq Ft
Est. Value
About This Home
This home is located at 8532 Biruta Ave, Orangevale, CA 95662 and is currently estimated at $747,310, approximately $340 per square foot. 8532 Biruta Ave is a home located in Sacramento County with nearby schools including Oakview Community Elementary School, Louis Pasteur Fundamental Middle School, and Casa Roble Fundamental High School.
Ownership History
Date
Name
Owned For
Owner Type
Purchase Details
Closed on
Mar 7, 2005
Sold by
Pesola Mario and Pesola Dawn
Bought by
Diemer Emerald L and Hayes Ernie
Current Estimated Value
Home Financials for this Owner
Home Financials are based on the most recent Mortgage that was taken out on this home.
Original Mortgage
$150,000
Outstanding Balance
$76,247
Interest Rate
5.65%
Mortgage Type
Purchase Money Mortgage
Estimated Equity
$671,063
Purchase Details
Closed on
Nov 2, 2001
Sold by
Reynolds Teri L and The Carole R Windsat Revocable
Bought by
Pesola Mario and Pesola Dawn
Home Financials for this Owner
Home Financials are based on the most recent Mortgage that was taken out on this home.
Original Mortgage
$283,500
Interest Rate
9.41%
Purchase Details
Closed on
May 13, 2001
Sold by
Windsat Carole R
Bought by
Windsat Carole R and Reynolds Teri L
Purchase Details
Closed on
Jan 24, 1994
Sold by
Shera Cathleen
Bought by
Shera Reza
Create a Home Valuation Report for This Property
The Home Valuation Report is an in-depth analysis detailing your home's value as well as a comparison with similar homes in the area
Home Values in the Area
Average Home Value in this Area
Purchase History
| Date | Buyer | Sale Price | Title Company |
|---|---|---|---|
| Diemer Emerald L | -- | Fidelity National Title Co | |
| Pesola Mario | $315,000 | Chicago Title Co | |
| Windsat Carole R | -- | -- | |
| Shera Reza | -- | Placer Title Co |
Source: Public Records
Mortgage History
| Date | Status | Borrower | Loan Amount |
|---|---|---|---|
| Open | Diemer Emerald L | $150,000 | |
| Previous Owner | Pesola Mario | $283,500 | |
| Closed | Diemer Emerald L | $150,000 |
Source: Public Records
Tax History
| Year | Tax Paid | Tax Assessment Tax Assessment Total Assessment is a certain percentage of the fair market value that is determined by local assessors to be the total taxable value of land and additions on the property. | Land | Improvement |
|---|---|---|---|---|
| 2025 | $6,845 | $583,115 | $168,308 | $414,807 |
| 2024 | $6,845 | $571,682 | $165,008 | $406,674 |
| 2023 | $6,664 | $560,473 | $161,773 | $398,700 |
| 2022 | $6,628 | $549,484 | $158,601 | $390,883 |
| 2021 | $6,524 | $538,711 | $155,492 | $383,219 |
| 2020 | $6,402 | $533,188 | $153,898 | $379,290 |
| 2019 | $6,273 | $522,734 | $150,881 | $371,853 |
| 2018 | $6,200 | $512,485 | $147,923 | $364,562 |
| 2017 | $5,825 | $476,921 | $119,230 | $357,691 |
| 2016 | $5,001 | $429,660 | $107,415 | $322,245 |
| 2015 | $4,535 | $390,600 | $97,650 | $292,950 |
| 2014 | $4,313 | $372,000 | $93,000 | $279,000 |
Source: Public Records
Map
Nearby Homes
- 8465 Day Lillies Ln
- 7200 Kenneth Ave
- 8572 Menke Way
- 7624 Larkspur Ln
- 7646 Creekridge Ln
- 8617 El Sobrante Way
- 8391 Cranford Way
- 7001 Jenner Ct
- 8733 Oak Ave
- 8209 Olivine Ave
- 8384 Old Ranch Rd
- 6900 Almond Ave Unit 99
- 8464 Old Ranch Rd
- 8356 Berman Walk Way
- 6939 Escallonia Dr
- 8344 Big Oak Dr
- 6840 Hickory Ave
- 8780 Elm Ave
- 7518 Quail Vista Ln
- 8631 Posadera Ave
Your Personal Tour Guide
Ask me questions while you tour the home.