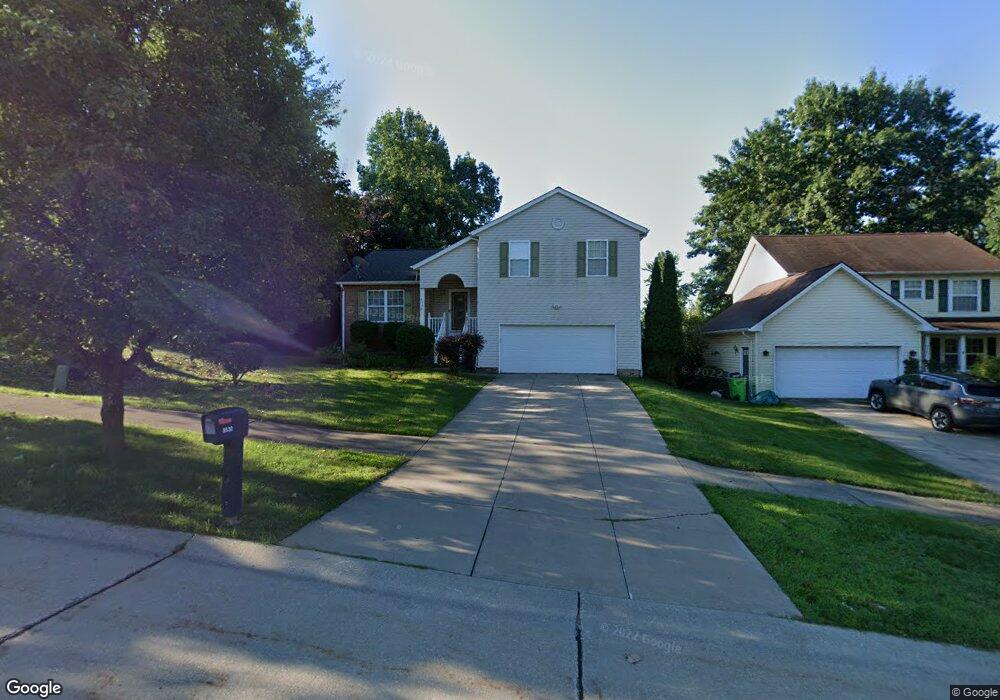
8532 Cherie Dr Cleveland, OH 44125
Estimated Value: $206,000 - $246,000
3
Beds
2
Baths
1,768
Sq Ft
$124/Sq Ft
Est. Value
About This Home
This home is located at 8532 Cherie Dr, Cleveland, OH 44125 and is currently estimated at $218,952, approximately $123 per square foot. 8532 Cherie Dr is a home located in Cuyahoga County with nearby schools including Garfield Heights High School, North Shore High School, and Holy Name Elementary School.
Ownership History
Date
Name
Owned For
Owner Type
Purchase Details
Closed on
Sep 27, 2006
Sold by
Thomas Jacob and Thomas Sheela
Bought by
Edwards Patricia R
Current Estimated Value
Home Financials for this Owner
Home Financials are based on the most recent Mortgage that was taken out on this home.
Original Mortgage
$137,600
Outstanding Balance
$82,652
Interest Rate
6.58%
Mortgage Type
Purchase Money Mortgage
Estimated Equity
$136,300
Purchase Details
Closed on
Jun 14, 1996
Sold by
Durham Dev Corp
Bought by
Thomas Jacob and Thomas Sheila
Purchase Details
Closed on
Oct 5, 1993
Sold by
Drake Linda C Trustee
Bought by
Durham Development Corpinc
Purchase Details
Closed on
Nov 2, 1984
Sold by
Conte Harry D
Bought by
Drake Linda C Trustee
Purchase Details
Closed on
Jan 1, 1977
Bought by
Conte Harry D
Create a Home Valuation Report for This Property
The Home Valuation Report is an in-depth analysis detailing your home's value as well as a comparison with similar homes in the area
Home Values in the Area
Average Home Value in this Area
Purchase History
| Date | Buyer | Sale Price | Title Company |
|---|---|---|---|
| Edwards Patricia R | $172,000 | Barristers Title Agency | |
| Thomas Jacob | $19,900 | -- | |
| Durham Development Corpinc | -- | -- | |
| Drake Linda C Trustee | -- | -- | |
| Conte Harry D | -- | -- |
Source: Public Records
Mortgage History
| Date | Status | Borrower | Loan Amount |
|---|---|---|---|
| Open | Edwards Patricia R | $137,600 |
Source: Public Records
Tax History Compared to Growth
Tax History
| Year | Tax Paid | Tax Assessment Tax Assessment Total Assessment is a certain percentage of the fair market value that is determined by local assessors to be the total taxable value of land and additions on the property. | Land | Improvement |
|---|---|---|---|---|
| 2024 | $5,314 | $63,140 | $10,745 | $52,395 |
| 2023 | $4,685 | $52,820 | $11,200 | $41,620 |
| 2022 | $4,661 | $52,820 | $11,200 | $41,620 |
| 2021 | $4,934 | $52,820 | $11,200 | $41,620 |
| 2020 | $4,576 | $47,180 | $10,010 | $37,170 |
| 2019 | $4,533 | $134,800 | $28,600 | $106,200 |
| 2018 | $4,733 | $47,180 | $10,010 | $37,170 |
| 2017 | $4,718 | $46,240 | $6,130 | $40,110 |
| 2016 | $4,789 | $46,240 | $6,130 | $40,110 |
| 2015 | $4,823 | $46,240 | $6,130 | $40,110 |
| 2014 | $4,823 | $50,260 | $6,650 | $43,610 |
Source: Public Records
Map
Nearby Homes
- 8531 Cherie Dr
- 8827 Park Heights Ave
- 9011 Park Heights Ave
- 9302 Park Heights Ave
- 5074 Donovan Dr
- 4977 E 90th St
- 4963 E 88th St
- 4928 E 84th St
- 4909 E 85th St
- 4932 E 93rd St
- 4915 E 88th St
- 9612 Park Heights Ave
- 4888 E 85th St
- 4903 E 94th St
- 9513 David Rd
- 4830 E 88th St
- 4840 E 84th St
- 9819 S Highland Ave
- 4821 E 85th St
- 4815 E 86th St