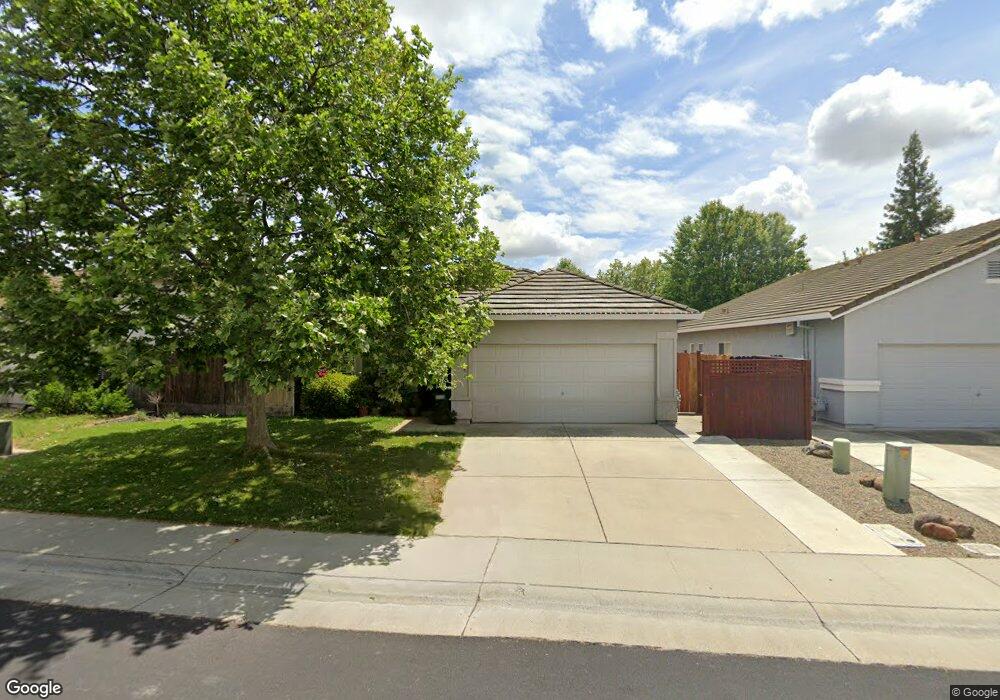
8536 Zinnia Way Elk Grove, CA 95624
North East Elk Grove NeighborhoodEstimated Value: $365,000 - $568,000
3
Beds
2
Baths
1,505
Sq Ft
$337/Sq Ft
Est. Value
About This Home
This home is located at 8536 Zinnia Way, Elk Grove, CA 95624 and is currently estimated at $506,544, approximately $336 per square foot. 8536 Zinnia Way is a home located in Sacramento County with nearby schools including Raymond Case Elementary School, Edward Harris Jr. Middle School, and Monterey Trail High School.
Ownership History
Date
Name
Owned For
Owner Type
Purchase Details
Closed on
May 9, 2003
Sold by
Santiago Hillary R and Santiago Hillary
Bought by
Santiago Hillary R
Current Estimated Value
Home Financials for this Owner
Home Financials are based on the most recent Mortgage that was taken out on this home.
Original Mortgage
$198,000
Outstanding Balance
$85,553
Interest Rate
5.71%
Mortgage Type
Purchase Money Mortgage
Estimated Equity
$420,991
Purchase Details
Closed on
Feb 15, 2002
Sold by
Santiago Hillary R and Santiago Ernest
Bought by
Santiago Hillary
Home Financials for this Owner
Home Financials are based on the most recent Mortgage that was taken out on this home.
Original Mortgage
$149,500
Interest Rate
7.04%
Purchase Details
Closed on
Jul 12, 1999
Sold by
Sheldon North Investors Lp
Bought by
Santiago Hillary R and Santiago Ernest
Home Financials for this Owner
Home Financials are based on the most recent Mortgage that was taken out on this home.
Original Mortgage
$146,575
Interest Rate
7.4%
Mortgage Type
FHA
Create a Home Valuation Report for This Property
The Home Valuation Report is an in-depth analysis detailing your home's value as well as a comparison with similar homes in the area
Home Values in the Area
Average Home Value in this Area
Purchase History
| Date | Buyer | Sale Price | Title Company |
|---|---|---|---|
| Santiago Hillary R | -- | -- | |
| Santiago Hillary | -- | Financial Title Company | |
| Santiago Hillary R | $149,000 | Stewart Title |
Source: Public Records
Mortgage History
| Date | Status | Borrower | Loan Amount |
|---|---|---|---|
| Open | Santiago Hillary R | $198,000 | |
| Closed | Santiago Hillary | $149,500 | |
| Closed | Santiago Hillary R | $146,575 |
Source: Public Records
Tax History Compared to Growth
Tax History
| Year | Tax Paid | Tax Assessment Tax Assessment Total Assessment is a certain percentage of the fair market value that is determined by local assessors to be the total taxable value of land and additions on the property. | Land | Improvement |
|---|---|---|---|---|
| 2025 | $2,604 | $228,232 | $69,151 | $159,081 |
| 2024 | $2,604 | $223,758 | $67,796 | $155,962 |
| 2023 | $2,537 | $219,371 | $66,467 | $152,904 |
| 2022 | $2,487 | $215,070 | $65,164 | $149,906 |
| 2021 | $2,448 | $210,854 | $63,887 | $146,967 |
| 2020 | $2,415 | $208,693 | $63,232 | $145,461 |
| 2019 | $2,369 | $204,602 | $61,993 | $142,609 |
| 2018 | $2,305 | $200,591 | $60,778 | $139,813 |
| 2017 | $2,264 | $196,659 | $59,587 | $137,072 |
| 2016 | $2,153 | $192,804 | $58,419 | $134,385 |
| 2015 | $2,113 | $189,909 | $57,542 | $132,367 |
| 2014 | $2,079 | $186,190 | $56,415 | $129,775 |
Source: Public Records
Map
Nearby Homes
- 8541 Lupin Way
- 8578 Hydrangea Ct
- 8647 Nightshade Ct
- 8447 Cassatt Way
- 8697 Tegea Way
- 8679 Bouvardia Ct
- 8643 Rothenburg Ct
- 8500 Brushwood Way
- 8805 Coral Berry Way
- 8809 Coral Berry Way
- 8788 Apricot Woods Way
- 8449 Cottonseed Way
- Plan 5 at Long Meadow
- Plan 3 at Long Meadow
- Plan 4 at Long Meadow
- Plan 1 at Long Meadow
- 8508 Cottonseed Way
- 8500 Cottonseed Way
- 8738 Freesia Dr
- 8496 Cottonseed Way
- 8532 Zinnia Way
- 8540 Zinnia Way
- 8551 Mission Bells Ct
- 8528 Zinnia Way
- 8555 Mission Bells Ct
- 8544 Zinnia Way
- 8547 Mission Bells Ct
- 8518 Ocotillo Ct
- 8517 Ocotillo Ct
- 8559 Mission Bells Ct
- 8548 Zinnia Way
- 8524 Zinnia Way
- 8543 Mission Bells Ct
- 8514 Ocotillo Ct
- 8507 Mountain Bell Dr
- 8552 Zinnia Way
- 8563 Mission Bells Ct
- 8511 Ocotillo Ct
- 8503 Mountain Bell Dr
- 8547 Zinnia Way