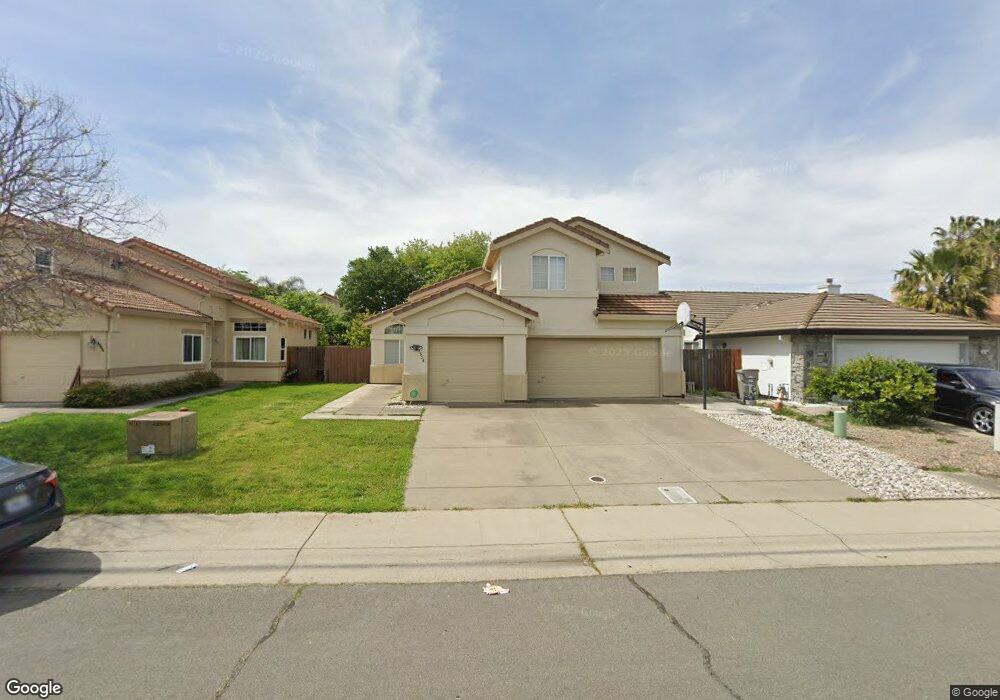
8538 Gibbs Way Sacramento, CA 95823
North Laguna NeighborhoodEstimated Value: $415,000 - $519,000
4
Beds
3
Baths
1,920
Sq Ft
$254/Sq Ft
Est. Value
About This Home
This home is located at 8538 Gibbs Way, Sacramento, CA 95823 and is currently estimated at $487,679, approximately $253 per square foot. 8538 Gibbs Way is a home located in Sacramento County with nearby schools including Barbara Comstock Morse Elementary School, Edward Harris Jr. Middle School, and Monterey Trail High School.
Ownership History
Date
Name
Owned For
Owner Type
Purchase Details
Closed on
Feb 25, 2013
Sold by
Dang Van Lai
Bought by
Quay Dau
Current Estimated Value
Purchase Details
Closed on
Dec 26, 2011
Sold by
Dang Van Lai and Dang Van
Bought by
Dang Van Lai and Su Dau Quay
Purchase Details
Closed on
Apr 5, 1999
Sold by
Fong Siringna and Dang Van Lai
Bought by
Dang Van Lai
Home Financials for this Owner
Home Financials are based on the most recent Mortgage that was taken out on this home.
Original Mortgage
$100,000
Interest Rate
6.91%
Purchase Details
Closed on
Aug 1, 1995
Sold by
Sterling Springs Sacramento Lp
Bought by
Fong Siringna and Dang Van
Home Financials for this Owner
Home Financials are based on the most recent Mortgage that was taken out on this home.
Original Mortgage
$80,000
Interest Rate
6.5%
Create a Home Valuation Report for This Property
The Home Valuation Report is an in-depth analysis detailing your home's value as well as a comparison with similar homes in the area
Home Values in the Area
Average Home Value in this Area
Purchase History
| Date | Buyer | Sale Price | Title Company |
|---|---|---|---|
| Quay Dau | -- | None Available | |
| Dang Van Lai | -- | None Available | |
| Dang Van Lai | -- | Placer Title Company | |
| Fong Siringna | $135,500 | First American Title Ins Co |
Source: Public Records
Mortgage History
| Date | Status | Borrower | Loan Amount |
|---|---|---|---|
| Previous Owner | Dang Van Lai | $100,000 | |
| Previous Owner | Fong Siringna | $80,000 |
Source: Public Records
Tax History Compared to Growth
Tax History
| Year | Tax Paid | Tax Assessment Tax Assessment Total Assessment is a certain percentage of the fair market value that is determined by local assessors to be the total taxable value of land and additions on the property. | Land | Improvement |
|---|---|---|---|---|
| 2025 | $2,769 | $224,528 | $58,128 | $166,400 |
| 2024 | $2,769 | $220,127 | $56,989 | $163,138 |
| 2023 | $2,693 | $215,812 | $55,872 | $159,940 |
| 2022 | $2,660 | $211,581 | $54,777 | $156,804 |
| 2021 | $2,545 | $207,433 | $53,703 | $153,730 |
| 2020 | $2,503 | $205,307 | $53,153 | $152,154 |
| 2019 | $2,457 | $201,282 | $52,111 | $149,171 |
| 2018 | $2,391 | $197,337 | $51,090 | $146,247 |
| 2017 | $2,342 | $193,469 | $50,089 | $143,380 |
| 2016 | $2,239 | $189,676 | $49,107 | $140,569 |
| 2015 | $2,190 | $186,828 | $48,370 | $138,458 |
| 2014 | $2,148 | $183,169 | $47,423 | $135,746 |
Source: Public Records
Map
Nearby Homes
- 8450 Montpelier Way
- 304 Cinema St
- 364 Cinema St
- 8642 Carlin Ave
- 8401 Sunblaze Way
- 6279 Dayspring Way
- 5226 La Pamela Way
- 5296 La Pamela Way
- 6131 Jacinto Ave
- 6429 Sunnyfield Way
- Danville Plan at Ventris Place
- Carefree Plan at Ventris Place
- Biltmore Plan at Ventris Place
- Astoria Plan at Ventris Place
- 6441 Ventris Walk
- 6317 Jacinto Ave
- 6325 Jacinto Ave
- 6403 Jacinto Ave
- 6411 Jacinto Ave
- 6419 Jacinto Ave