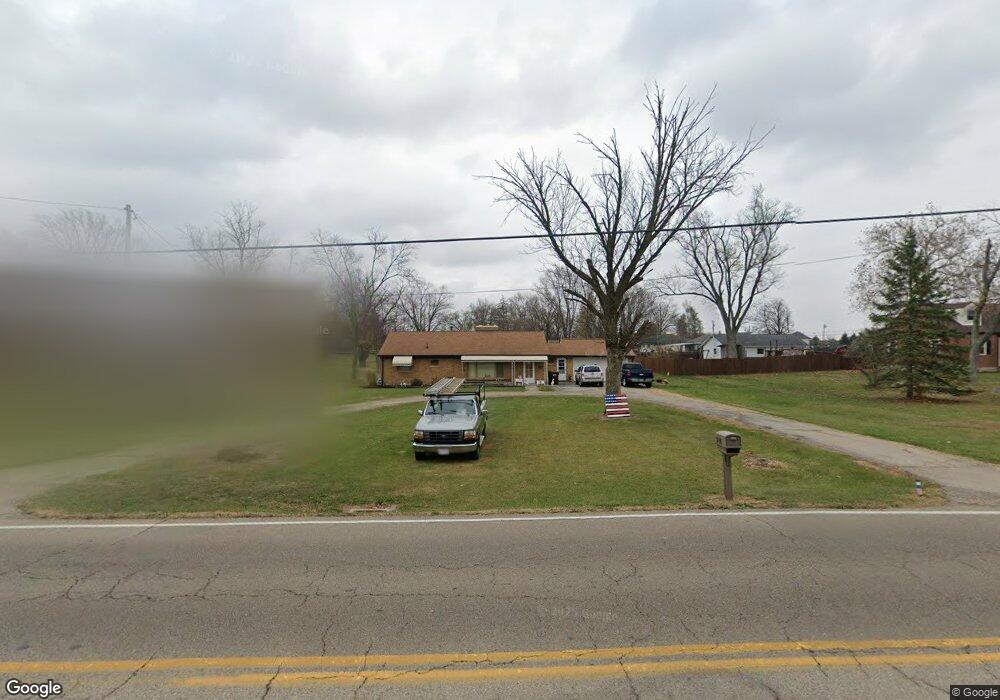
8538 Peters Pike Vandalia, OH 45377
Estimated Value: $152,000 - $227,000
2
Beds
1
Bath
1,288
Sq Ft
$153/Sq Ft
Est. Value
About This Home
This home is located at 8538 Peters Pike, Vandalia, OH 45377 and is currently estimated at $196,769, approximately $152 per square foot. 8538 Peters Pike is a home located in Montgomery County with nearby schools including Helke Elementary School, Morton Middle School, and Butler High School.
Ownership History
Date
Name
Owned For
Owner Type
Purchase Details
Closed on
Oct 29, 2021
Sold by
Watson Gary and Watson Deborah
Bought by
Barney Ernest E and Barney Kathleen
Current Estimated Value
Home Financials for this Owner
Home Financials are based on the most recent Mortgage that was taken out on this home.
Original Mortgage
$212,505
Outstanding Balance
$194,425
Interest Rate
2.88%
Mortgage Type
VA
Estimated Equity
$2,344
Purchase Details
Closed on
May 21, 2009
Sold by
Federal Home Loan Mortgage Corporation
Bought by
Watson Gary and Watson Deborah
Purchase Details
Closed on
Oct 21, 2008
Sold by
Medlar Joyce A
Bought by
Federal Home Loan Mortgage Corp
Purchase Details
Closed on
Jan 17, 2001
Sold by
Klotzbach Howard E and Klotzbach Ida M
Bought by
Medlar Joyce A
Purchase Details
Closed on
Nov 15, 2000
Sold by
Klotzbach Inez M
Bought by
Klotzbach Howard E
Purchase Details
Closed on
Sep 12, 2000
Sold by
Estate Of Charles E Klotzbach
Bought by
Kletzbach Inez M
Create a Home Valuation Report for This Property
The Home Valuation Report is an in-depth analysis detailing your home's value as well as a comparison with similar homes in the area
Home Values in the Area
Average Home Value in this Area
Purchase History
| Date | Buyer | Sale Price | Title Company |
|---|---|---|---|
| Barney Ernest E | $121,600 | Home Services Title Llc | |
| Watson Gary | $50,100 | Attorney | |
| Federal Home Loan Mortgage Corp | $65,336 | None Available | |
| Medlar Joyce A | -- | -- | |
| Klotzbach Howard E | -- | -- | |
| Kletzbach Inez M | -- | -- |
Source: Public Records
Mortgage History
| Date | Status | Borrower | Loan Amount |
|---|---|---|---|
| Open | Barney Ernest E | $212,505 |
Source: Public Records
Tax History Compared to Growth
Tax History
| Year | Tax Paid | Tax Assessment Tax Assessment Total Assessment is a certain percentage of the fair market value that is determined by local assessors to be the total taxable value of land and additions on the property. | Land | Improvement |
|---|---|---|---|---|
| 2024 | $2,663 | $52,250 | $15,070 | $37,180 |
| 2023 | $2,663 | $52,250 | $15,070 | $37,180 |
| 2022 | $2,449 | $40,310 | $11,600 | $28,710 |
| 2021 | $3,123 | $40,310 | $11,600 | $28,710 |
| 2020 | $3,115 | $40,310 | $11,600 | $28,710 |
| 2019 | $3,267 | $38,570 | $9,180 | $29,390 |
| 2018 | $3,272 | $38,570 | $9,180 | $29,390 |
| 2017 | $3,251 | $38,570 | $9,180 | $29,390 |
| 2016 | $3,225 | $37,540 | $9,660 | $27,880 |
| 2015 | $3,058 | $37,540 | $9,660 | $27,880 |
| 2014 | $3,058 | $37,540 | $9,660 | $27,880 |
| 2012 | -- | $37,020 | $9,660 | $27,360 |
Source: Public Records
Map
Nearby Homes
- 8375 Peters Pike
- 3431 Mulberry Rd
- 1588 Middle Park Dr
- 3465 Turtle Shell Dr
- 727 Paula St
- 3361 Sea Turtle Dr
- 1051 Bailey Ave
- 1072 Pool Ave
- Bellamy Plan at Yorkshire Reserve - The Oaks at Yorkshire Reserve
- Newcastle Plan at Yorkshire Reserve - The Oaks at Yorkshire Reserve
- Chatham Plan at Yorkshire Reserve - The Oaks at Yorkshire Reserve
- Holcombe Plan at Yorkshire Reserve - The Oaks at Yorkshire Reserve
- Milford Plan at Yorkshire Reserve - The Oaks at Yorkshire Reserve
- Johnstown Plan at Yorkshire Reserve - The Oaks at Yorkshire Reserve
- 910 Bright Ave
- 7612 Turtleback Dr
- 7568 Yorkshire Dr
- 7562 Yorkshire Dr
- 3114 Northerton Ct
- 1631 Ashley Place
- 8566 Peters Pike
- 8500 Peters Pike
- 8586 Peters Pike
- 3305 Stonequarry Rd
- 3309 Stonequarry Rd
- 8606 Peters Pike
- 3300 Stonequarry Rd
- 8640 Peters Pike
- 3313 Stonequarry Rd
- 3290 Stonequarry Rd
- 1272 Bramley Ct
- 3321 Stonequarry Rd
- 3284 Stonequarry Rd
- 8445 Peters Pike
- 1268 Bramley Ct
- 8678 Peters Pike
- 1301 Stonequarry Rd
- 1256 Bramley Ct
- 1235 Greystone Cir
- 3280 Stonequarry Rd