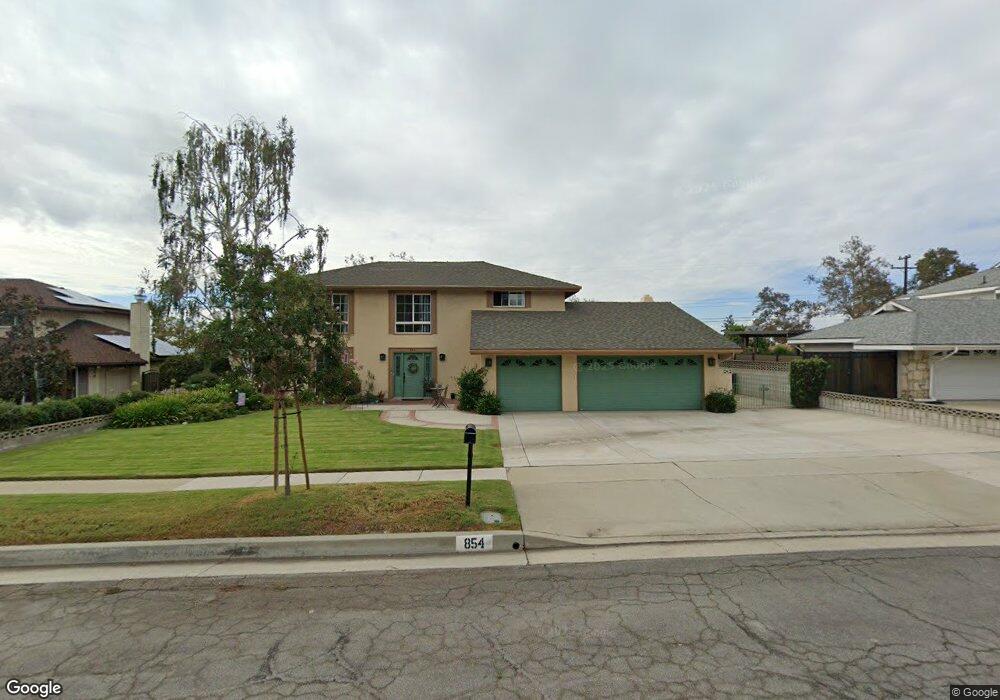
854 Carson St Upland, CA 91784
Estimated Value: $937,000 - $1,015,000
5
Beds
3
Baths
2,423
Sq Ft
$400/Sq Ft
Est. Value
About This Home
This home is located at 854 Carson St, Upland, CA 91784 and is currently estimated at $968,776, approximately $399 per square foot. 854 Carson St is a home located in San Bernardino County with nearby schools including Pepper Tree Elementary, Pioneer Junior High School, and Upland High School.
Ownership History
Date
Name
Owned For
Owner Type
Purchase Details
Closed on
Jun 10, 2005
Sold by
Samarin Julia
Bought by
Vanhorn Christopher and Christopher Van Horn Family Tr
Current Estimated Value
Create a Home Valuation Report for This Property
The Home Valuation Report is an in-depth analysis detailing your home's value as well as a comparison with similar homes in the area
Home Values in the Area
Average Home Value in this Area
Purchase History
| Date | Buyer | Sale Price | Title Company |
|---|---|---|---|
| Vanhorn Christopher | $23,500 | New Century Title Company |
Source: Public Records
Tax History
| Year | Tax Paid | Tax Assessment Tax Assessment Total Assessment is a certain percentage of the fair market value that is determined by local assessors to be the total taxable value of land and additions on the property. | Land | Improvement |
|---|---|---|---|---|
| 2025 | $2,139 | $355,404 | $124,392 | $231,012 |
| 2024 | $2,094 | $348,435 | $121,953 | $226,482 |
| 2023 | $2,118 | $341,603 | $119,562 | $222,041 |
| 2022 | $2,156 | $334,905 | $117,218 | $217,687 |
| 2021 | $2,145 | $328,339 | $114,920 | $213,419 |
| 2020 | $2,116 | $324,973 | $113,742 | $211,231 |
| 2019 | $2,121 | $318,601 | $111,512 | $207,089 |
| 2018 | $3,469 | $312,353 | $109,325 | $203,028 |
| 2017 | $3,368 | $306,228 | $107,181 | $199,047 |
| 2016 | $3,168 | $300,223 | $105,079 | $195,144 |
| 2015 | $3,095 | $295,714 | $103,501 | $192,213 |
| 2014 | $3,014 | $289,922 | $101,474 | $188,448 |
Source: Public Records
Map
Nearby Homes
- 1669 N San Antonio Ave
- 1623 N Vallejo Way
- 888 Via Maria
- 635 W 16th St
- 612 W 17th St
- 1503 N Albright Ave
- 1629 N Palm Ave
- 1695 N Palm Ave
- 1613 Erin Ave
- 256 W 18th St
- 779 Coral Tree Way
- 1234 Fairway Cir
- 1238 Fairway Cir
- 1614 Carmel Cir W
- 1267 Preston Ct
- 252 W 19th St
- 1931 Eloise Way
- 1640 Lakewood Ave
- 1844 N 1st Ave
- 1646 Glenwood Ave
- 844 Carson St
- 868 Carson St
- 863 Calle Del Sol
- 855 Calle Del Sol
- 873 Calle Del Sol
- 845 Calle Del Sol
- 832 Carson St
- 882 Carson St
- 859 Carson St
- 879 Calle Del Sol
- 837 Calle Del Sol
- 871 Carson St
- 837 Carson St
- 889 Calle Del Sol
- 829 Calle Del Sol
- 870 Calle Del Sol
- 1668 Benton Way
- 896 Carson St
- 825 Carson St
- 1677 Andover Way
Your Personal Tour Guide
Ask me questions while you tour the home.