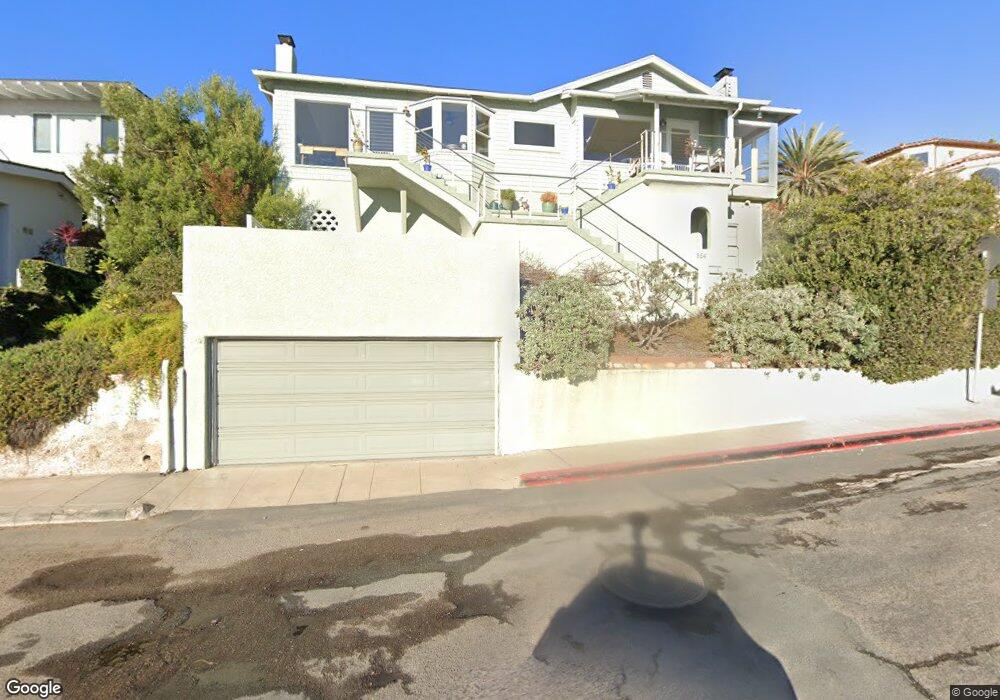
854 Harbor View Place San Diego, CA 92106
La Playa NeighborhoodEstimated Value: $1,551,000 - $2,346,000
2
Beds
2
Baths
1,488
Sq Ft
$1,315/Sq Ft
Est. Value
About This Home
This home is located at 854 Harbor View Place, San Diego, CA 92106 and is currently estimated at $1,956,739, approximately $1,315 per square foot. 854 Harbor View Place is a home located in San Diego County with nearby schools including Cabrillo Elementary School, Richard Henry Dana Middle School, and Correia Middle School.
Ownership History
Date
Name
Owned For
Owner Type
Purchase Details
Closed on
Jun 12, 2015
Sold by
Mekay John P and Mckay Priscilla W
Bought by
Mckay John P and Mcckay Priscilla W
Current Estimated Value
Purchase Details
Closed on
Mar 6, 1998
Sold by
Priest Beverly A
Bought by
Mckay John P and Mckay Priscilla W
Home Financials for this Owner
Home Financials are based on the most recent Mortgage that was taken out on this home.
Original Mortgage
$100,000
Outstanding Balance
$14,127
Interest Rate
4.35%
Estimated Equity
$1,942,612
Purchase Details
Closed on
May 23, 1997
Sold by
Pearson Ronald W
Bought by
Priest Beverly A
Home Financials for this Owner
Home Financials are based on the most recent Mortgage that was taken out on this home.
Original Mortgage
$375,000
Interest Rate
7.98%
Mortgage Type
Seller Take Back
Create a Home Valuation Report for This Property
The Home Valuation Report is an in-depth analysis detailing your home's value as well as a comparison with similar homes in the area
Home Values in the Area
Average Home Value in this Area
Purchase History
| Date | Buyer | Sale Price | Title Company |
|---|---|---|---|
| Mckay John P | -- | None Available | |
| Mckay John P | $575,000 | First American Title | |
| Priest Beverly A | $475,000 | American Title Ins Co |
Source: Public Records
Mortgage History
| Date | Status | Borrower | Loan Amount |
|---|---|---|---|
| Open | Mckay John P | $100,000 | |
| Previous Owner | Priest Beverly A | $375,000 |
Source: Public Records
Tax History Compared to Growth
Tax History
| Year | Tax Paid | Tax Assessment Tax Assessment Total Assessment is a certain percentage of the fair market value that is determined by local assessors to be the total taxable value of land and additions on the property. | Land | Improvement |
|---|---|---|---|---|
| 2025 | $11,335 | $938,549 | $619,702 | $318,847 |
| 2024 | $11,335 | $920,147 | $607,551 | $312,596 |
| 2023 | $11,085 | $902,106 | $595,639 | $306,467 |
| 2022 | $10,705 | $884,418 | $583,960 | $300,458 |
| 2021 | $10,631 | $867,077 | $572,510 | $294,567 |
| 2020 | $10,501 | $858,187 | $566,640 | $291,547 |
| 2019 | $10,312 | $841,361 | $555,530 | $285,831 |
| 2018 | $9,639 | $824,865 | $544,638 | $280,227 |
| 2017 | $9,409 | $808,692 | $533,959 | $274,733 |
| 2016 | $9,258 | $792,837 | $523,490 | $269,347 |
| 2015 | $8,967 | $767,929 | $513,627 | $254,302 |
| 2014 | $8,778 | $748,965 | $503,566 | $245,399 |
Source: Public Records
Map
Nearby Homes
- 885 Rosecrans St
- 936 Armada Terrace
- 3276 Talbot St
- 952 Rosecrans St
- 936 Bangor St
- 3016 Rogers St
- 3301 Trumbull St
- 1021 Scott St Unit 225
- 1021 Scott St Unit 256
- 1021 Scott St Unit 122
- 1021 Scott St Unit 103
- 1021 Scott St Unit 130
- 1021 Scott St Unit 218
- 3034-50 Canon St
- 1161 Akron St
- 3130 Avenida de Portugal
- 3130 Avenida de Portugal Unit 305
- 617 Gage Dr
- 567 Gage Ln
- 1268-74 Locust St
- 840 Armada Terrace
- 3221 Lucinda St
- 3208 Lucinda St
- 845 Armada Terrace
- 3233 Lucinda St
- 825 Harbor View Place
- 3235 Lucinda St
- 832 Armada Terrace
- 874 Harbor View Place
- 851 Armada Terrace
- 3054 Armada Place
- 835 Armada Terrace
- 829 Armada Terrace
- 3226 Lucinda St Unit 531-632-11-00
- 3226 Lucinda St
- 867 Harbor View Place
- 858 Armada Terrace
- 857 Armada Terrace
- 3245 Lucinda St
- 3236 Lucinda St