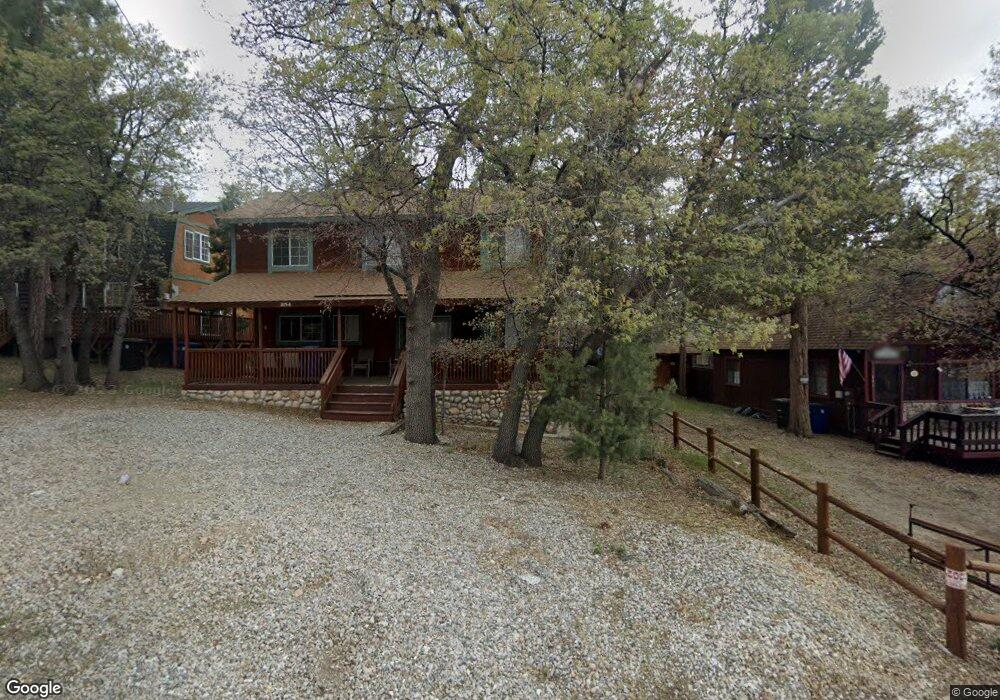
854 Holmes Ln Sugarloaf, CA 92386
Estimated Value: $308,755 - $387,000
3
Beds
2
Baths
1,260
Sq Ft
$266/Sq Ft
Est. Value
About This Home
This home is located at 854 Holmes Ln, Sugarloaf, CA 92386 and is currently estimated at $335,689, approximately $266 per square foot. 854 Holmes Ln is a home with nearby schools including Baldwin Lane Elementary School, Big Bear Middle School, and Big Bear High School.
Ownership History
Date
Name
Owned For
Owner Type
Purchase Details
Closed on
Jul 29, 2003
Sold by
Beach Gregory C and Beach Tracy L
Bought by
Beach Gregory Charles and Beach Tracy Lee
Current Estimated Value
Purchase Details
Closed on
Mar 22, 2001
Sold by
Chamberlain Robert J and Chamberlain Shirley J
Bought by
Beach Gregory C and Beach Tracy L
Home Financials for this Owner
Home Financials are based on the most recent Mortgage that was taken out on this home.
Original Mortgage
$80,000
Outstanding Balance
$28,912
Interest Rate
6.92%
Estimated Equity
$306,777
Create a Home Valuation Report for This Property
The Home Valuation Report is an in-depth analysis detailing your home's value as well as a comparison with similar homes in the area
Home Values in the Area
Average Home Value in this Area
Purchase History
| Date | Buyer | Sale Price | Title Company |
|---|---|---|---|
| Beach Gregory Charles | -- | -- | |
| Beach Gregory C | -- | -- | |
| Beach Gregory C | $100,000 | Fidelity National Title Ins |
Source: Public Records
Mortgage History
| Date | Status | Borrower | Loan Amount |
|---|---|---|---|
| Open | Beach Gregory C | $80,000 |
Source: Public Records
Tax History
| Year | Tax Paid | Tax Assessment Tax Assessment Total Assessment is a certain percentage of the fair market value that is determined by local assessors to be the total taxable value of land and additions on the property. | Land | Improvement |
|---|---|---|---|---|
| 2025 | $2,963 | $150,689 | $37,672 | $113,017 |
| 2024 | $2,823 | $147,734 | $36,933 | $110,801 |
| 2023 | $2,726 | $144,837 | $36,209 | $108,628 |
| 2022 | $2,613 | $141,997 | $35,499 | $106,498 |
| 2021 | $2,552 | $139,213 | $34,803 | $104,410 |
| 2020 | $2,545 | $137,785 | $34,446 | $103,339 |
| 2019 | $2,485 | $135,084 | $33,771 | $101,313 |
| 2018 | $2,390 | $132,435 | $33,109 | $99,326 |
| 2017 | $2,322 | $129,838 | $32,460 | $97,378 |
| 2016 | $2,263 | $127,293 | $31,824 | $95,469 |
| 2015 | $2,224 | $125,381 | $31,346 | $94,035 |
| 2014 | $2,179 | $122,925 | $30,732 | $92,193 |
Source: Public Records
Map
Nearby Homes
Your Personal Tour Guide
Ask me questions while you tour the home.