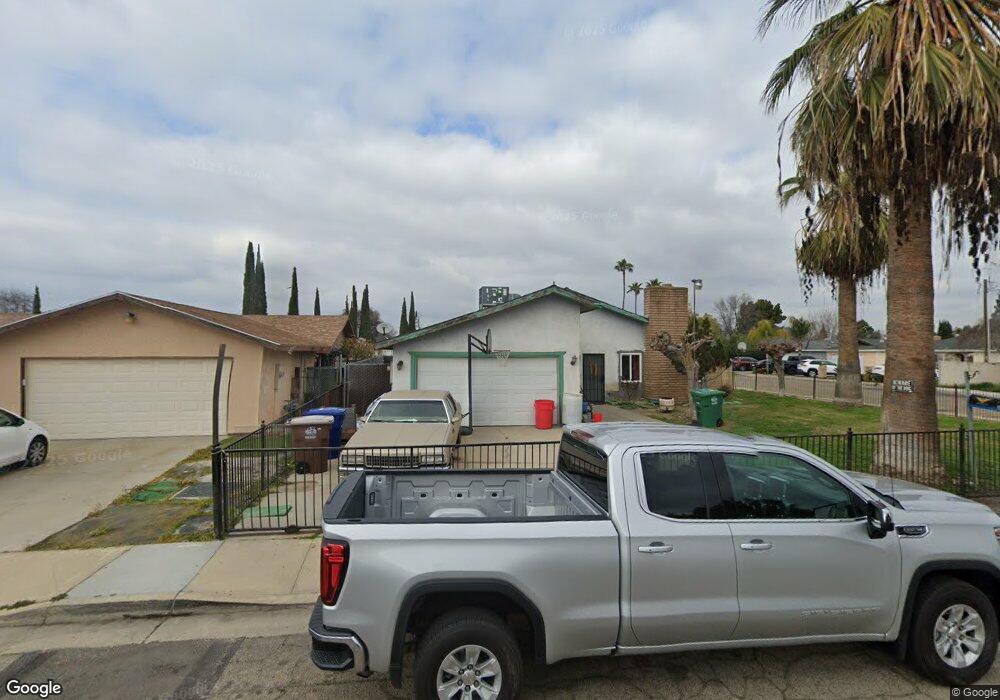
854 Jefferson Way Sanger, CA 93657
Estimated Value: $306,000 - $325,582
3
Beds
2
Baths
1,320
Sq Ft
$241/Sq Ft
Est. Value
About This Home
This home is located at 854 Jefferson Way, Sanger, CA 93657 and is currently estimated at $318,194, approximately $241 per square foot. 854 Jefferson Way is a home located in Fresno County with nearby schools including Jefferson Elementary School, Washington Academic Middle School, and Sanger High School.
Ownership History
Date
Name
Owned For
Owner Type
Purchase Details
Closed on
Dec 20, 2006
Sold by
Pena Raul N and Hernandez Maria J
Bought by
Pena Raul N
Current Estimated Value
Purchase Details
Closed on
Dec 11, 2003
Sold by
Pena Raul N and Hernandez Maria J
Bought by
Pena Raul N
Home Financials for this Owner
Home Financials are based on the most recent Mortgage that was taken out on this home.
Original Mortgage
$120,000
Outstanding Balance
$55,450
Interest Rate
5.84%
Mortgage Type
New Conventional
Estimated Equity
$262,744
Purchase Details
Closed on
Dec 1, 1995
Sold by
Aguilar Pedro
Bought by
Pena Raul N and Hernandez Maria J
Home Financials for this Owner
Home Financials are based on the most recent Mortgage that was taken out on this home.
Original Mortgage
$63,000
Interest Rate
7.25%
Purchase Details
Closed on
Feb 13, 1995
Sold by
Aguilar Pedro and Perez Carmen
Bought by
Aguilar Pedro
Create a Home Valuation Report for This Property
The Home Valuation Report is an in-depth analysis detailing your home's value as well as a comparison with similar homes in the area
Home Values in the Area
Average Home Value in this Area
Purchase History
| Date | Buyer | Sale Price | Title Company |
|---|---|---|---|
| Pena Raul N | -- | Financial Title Company | |
| Pena Raul N | -- | First American Title Ins Co | |
| Pena Raul N | $70,000 | Chicago Title Co | |
| Aguilar Pedro | -- | -- |
Source: Public Records
Mortgage History
| Date | Status | Borrower | Loan Amount |
|---|---|---|---|
| Open | Pena Raul N | $120,000 | |
| Previous Owner | Pena Raul N | $63,000 |
Source: Public Records
Tax History
| Year | Tax Paid | Tax Assessment Tax Assessment Total Assessment is a certain percentage of the fair market value that is determined by local assessors to be the total taxable value of land and additions on the property. | Land | Improvement |
|---|---|---|---|---|
| 2025 | $1,988 | $155,695 | $55,601 | $100,094 |
| 2023 | $1,862 | $149,651 | $53,443 | $96,208 |
| 2022 | $1,834 | $146,718 | $52,396 | $94,322 |
| 2021 | $1,819 | $143,842 | $51,369 | $92,473 |
| 2020 | $1,766 | $142,368 | $50,843 | $91,525 |
| 2019 | $1,731 | $139,578 | $49,847 | $89,731 |
| 2018 | $1,659 | $136,842 | $48,870 | $87,972 |
| 2017 | $1,631 | $134,160 | $47,912 | $86,248 |
| 2016 | $1,534 | $131,530 | $46,973 | $84,557 |
| 2015 | $1,546 | $129,555 | $46,268 | $83,287 |
| 2014 | $1,526 | $127,018 | $45,362 | $81,656 |
Source: Public Records
Map
Nearby Homes
- 1240 J St
- 1428 J St
- 658 Rebeca Ave
- 3670 S Newmark Ave
- 3680 S Newmark Ave
- 913 Harriett Ave
- 927 N St
- 1312 P St
- 720 L St
- 3061 Orchid Ave
- 1733 W Metzler Dr
- 426 L St
- 521 O St
- 824 Hoag Ave
- 983 Church Ave
- 923 Holt Ave
- 1943 Richard Ave
- 1112 Cottle Ave
- 428 Greenwood Ave
- 0 E Annadale Ave Unit W. of S. Riverbend A
- 864 Jefferson Way
- 1245 Millwood Dr
- 1243 Millwood Dr
- 1262 Millwood Dr
- 1291 Millwood Dr
- 872 Jefferson Way
- 863 Jefferson Way
- 1252 Millwood Dr
- 871 Jefferson Way
- 1299 Tucker Ave
- 1242 Millwood Dr
- 1237 Millwood Dr
- 878 Jefferson Way
- 1285 Tucker Ave
- 880 Jefferson Way
- 877 Jefferson Way
- 1269 Tucker Ave
- 1232 Millwood Dr
- 1223 Millwood Dr
- 1238 Faller Ave
Your Personal Tour Guide
Ask me questions while you tour the home.