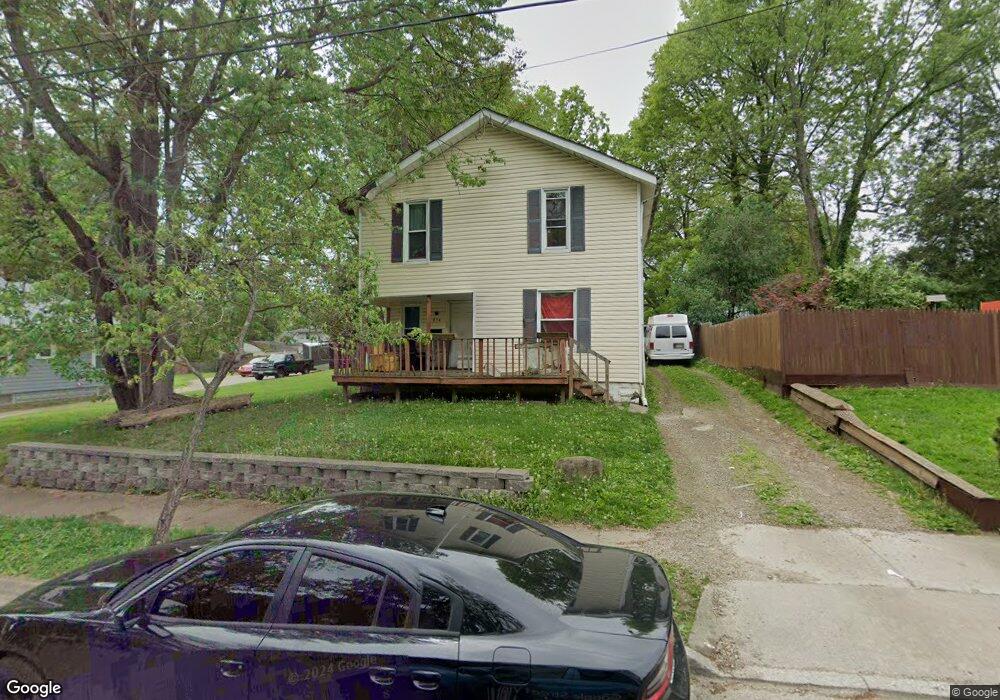
854 Nevin St Akron, OH 44310
North Hill NeighborhoodEstimated Value: $118,000 - $142,000
4
Beds
2
Baths
1,592
Sq Ft
$85/Sq Ft
Est. Value
About This Home
This home is located at 854 Nevin St, Akron, OH 44310 and is currently estimated at $134,744, approximately $84 per square foot. 854 Nevin St is a home located in Summit County with nearby schools including North High School, Edge Academy, The, and Steel Academy.
Ownership History
Date
Name
Owned For
Owner Type
Purchase Details
Closed on
Sep 25, 2007
Sold by
Deutsche Bank National Trust Co
Bought by
Graham Michael and Graham Amy
Current Estimated Value
Purchase Details
Closed on
Aug 22, 2007
Sold by
Boggs Glenn T
Bought by
Deutsche Bank National Trust Co and Certificate Holders Of Soundview Home Lo
Purchase Details
Closed on
Oct 27, 1998
Sold by
Bailey Helen P
Bought by
Boggs Glenn T
Home Financials for this Owner
Home Financials are based on the most recent Mortgage that was taken out on this home.
Original Mortgage
$54,000
Interest Rate
6.59%
Purchase Details
Closed on
Aug 31, 1998
Sold by
Cardina Philip M
Bought by
Bailey Helen P
Home Financials for this Owner
Home Financials are based on the most recent Mortgage that was taken out on this home.
Original Mortgage
$54,000
Interest Rate
6.59%
Create a Home Valuation Report for This Property
The Home Valuation Report is an in-depth analysis detailing your home's value as well as a comparison with similar homes in the area
Home Values in the Area
Average Home Value in this Area
Purchase History
| Date | Buyer | Sale Price | Title Company |
|---|---|---|---|
| Graham Michael | $22,500 | Accutitle Agency Inc | |
| Deutsche Bank National Trust Co | $48,000 | None Available | |
| Boggs Glenn T | $60,000 | Bond & Associates Title Agen | |
| Bailey Helen P | $63,000 | -- |
Source: Public Records
Mortgage History
| Date | Status | Borrower | Loan Amount |
|---|---|---|---|
| Previous Owner | Boggs Glenn T | $54,000 |
Source: Public Records
Tax History Compared to Growth
Tax History
| Year | Tax Paid | Tax Assessment Tax Assessment Total Assessment is a certain percentage of the fair market value that is determined by local assessors to be the total taxable value of land and additions on the property. | Land | Improvement |
|---|---|---|---|---|
| 2025 | $1,931 | $34,721 | $7,396 | $27,325 |
| 2024 | $1,919 | $34,721 | $7,396 | $27,325 |
| 2023 | $1,931 | $34,721 | $7,396 | $27,325 |
| 2022 | $1,880 | $26,706 | $5,688 | $21,018 |
| 2021 | $1,882 | $26,706 | $5,688 | $21,018 |
| 2020 | $1,855 | $26,710 | $5,690 | $21,020 |
| 2019 | $1,344 | $17,220 | $5,460 | $11,760 |
| 2018 | $1,327 | $17,220 | $5,460 | $11,760 |
| 2017 | $1,347 | $17,220 | $5,460 | $11,760 |
| 2016 | $1,348 | $17,220 | $5,460 | $11,760 |
| 2015 | $1,347 | $17,220 | $5,460 | $11,760 |
| 2014 | $1,337 | $17,220 | $5,460 | $11,760 |
| 2013 | $1,272 | $16,680 | $5,460 | $11,220 |
Source: Public Records
Map
Nearby Homes