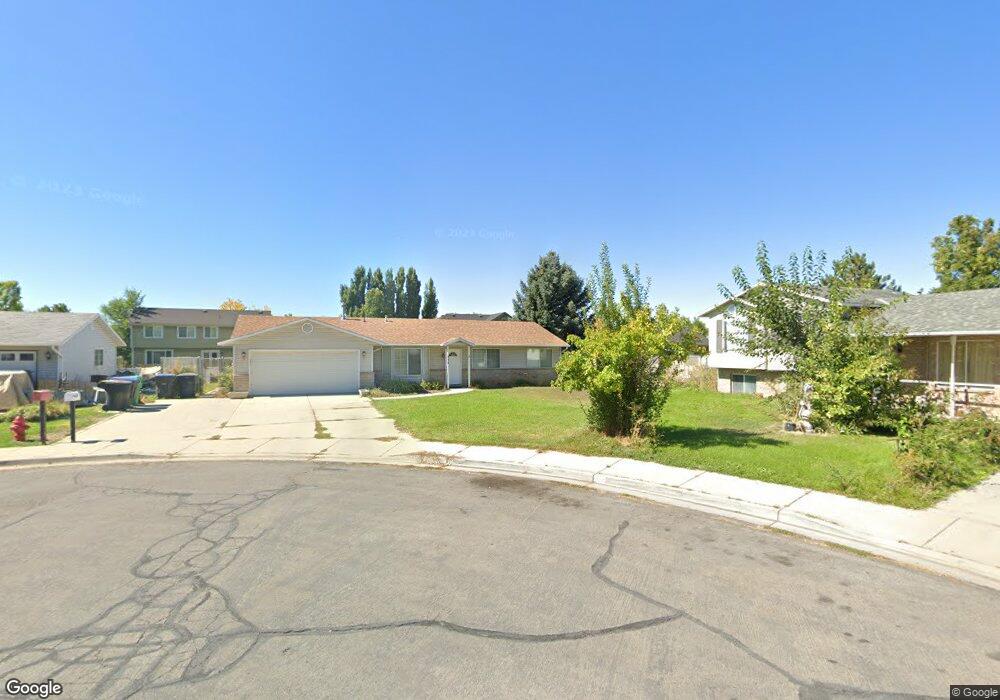
854 W 1340 S Provo, UT 84601
Franklin NeighborhoodEstimated Value: $465,000 - $510,000
3
Beds
2
Baths
1,473
Sq Ft
$330/Sq Ft
Est. Value
About This Home
This home is located at 854 W 1340 S, Provo, UT 84601 and is currently estimated at $485,614, approximately $329 per square foot. 854 W 1340 S is a home located in Utah County with nearby schools including Sunset View Elementary School, Dixon Middle School, and Provo High School.
Ownership History
Date
Name
Owned For
Owner Type
Purchase Details
Closed on
Jul 17, 2017
Sold by
Poulson Shirley Genille and The Shirley Genille Poulson Tr
Bought by
Deng Shenglon and Dong Ying
Current Estimated Value
Home Financials for this Owner
Home Financials are based on the most recent Mortgage that was taken out on this home.
Original Mortgage
$187,200
Outstanding Balance
$155,745
Interest Rate
3.94%
Estimated Equity
$329,869
Purchase Details
Closed on
Nov 6, 2003
Sold by
Poulson Shirley Genille
Bought by
Poulson Shirley Genille
Purchase Details
Closed on
Apr 16, 1999
Sold by
Poulson Shirley Genille
Bought by
Poulson Shirley Genille and Shirley Genille Poulson Trust
Purchase Details
Closed on
Dec 1, 1998
Sold by
Hull Carl G and Hull Melody P
Bought by
Poulson Shirley Genille
Purchase Details
Closed on
Nov 14, 1997
Sold by
Skabelund Steven R and Skabelund Vanette D
Bought by
Hull Carl and Hull Melody
Home Financials for this Owner
Home Financials are based on the most recent Mortgage that was taken out on this home.
Original Mortgage
$150,000
Interest Rate
7.3%
Create a Home Valuation Report for This Property
The Home Valuation Report is an in-depth analysis detailing your home's value as well as a comparison with similar homes in the area
Home Values in the Area
Average Home Value in this Area
Purchase History
We collect this data history from publicly available records. To have your information removed, we recommend requesting removal directly through your county’s website.
| Date | Buyer | Sale Price | Title Company |
|---|---|---|---|
| Deng Shenglon | -- | None Available | |
| Poulson Shirley Genille | -- | -- | |
| Poulson Shirley Genille | -- | -- | |
| Poulson Shirley Genille | -- | First American Title Co | |
| Hull Carl | -- | First American Title |
Source: Public Records
Mortgage History
We collect this data history from publicly available records. To have your information removed, we recommend requesting removal directly through your county’s website.
| Date | Status | Borrower | Loan Amount |
|---|---|---|---|
| Open | Deng Shenglon | $187,200 | |
| Previous Owner | Hull Carl | $150,000 |
Source: Public Records
Tax History
| Year | Tax Paid | Tax Assessment Tax Assessment Total Assessment is a certain percentage of the fair market value that is determined by local assessors to be the total taxable value of land and additions on the property. | Land | Improvement |
|---|---|---|---|---|
| 2025 | $2,349 | $240,680 | -- | -- |
| 2024 | $2,349 | $231,220 | $0 | $0 |
| 2023 | $2,302 | $223,355 | $0 | $0 |
| 2022 | $2,288 | $223,850 | $0 | $0 |
| 2021 | $1,751 | $298,800 | $99,000 | $199,800 |
| 2020 | $1,698 | $271,600 | $90,000 | $181,600 |
| 2019 | $1,561 | $259,700 | $90,000 | $169,700 |
| 2018 | $1,364 | $230,100 | $82,500 | $147,600 |
| 2017 | $1,255 | $116,380 | $0 | $0 |
| 2016 | $1,228 | $106,095 | $0 | $0 |
| 2015 | -- | $95,535 | $0 | $0 |
| 2014 | -- | $93,445 | $0 | $0 |
Source: Public Records
Map
Nearby Homes
- 1464 S 990 W
- 1136 S 860 W
- 1575 S 960 W
- 1575 S 960 W Unit 155
- 596 W 1340 S
- 1592 S 960 W
- 1592 S 960 W Unit 102
- 1711 870 W Unit 124
- 1711 S 870 W
- 1095 S 500 W Unit 11
- 1798 S 730 W
- 1094 S 450 W
- 1604 S 450 W
- 991 S 500 W
- 784 W Heather Ln
- 239 S Meadow Dr Unit 10
- 131 S Meadow Dr Unit 20
- 658 W 1920 S Unit 1059
- 311 W 1610 S
- 354 W 1670 S
Your Personal Tour Guide
Ask me questions while you tour the home.