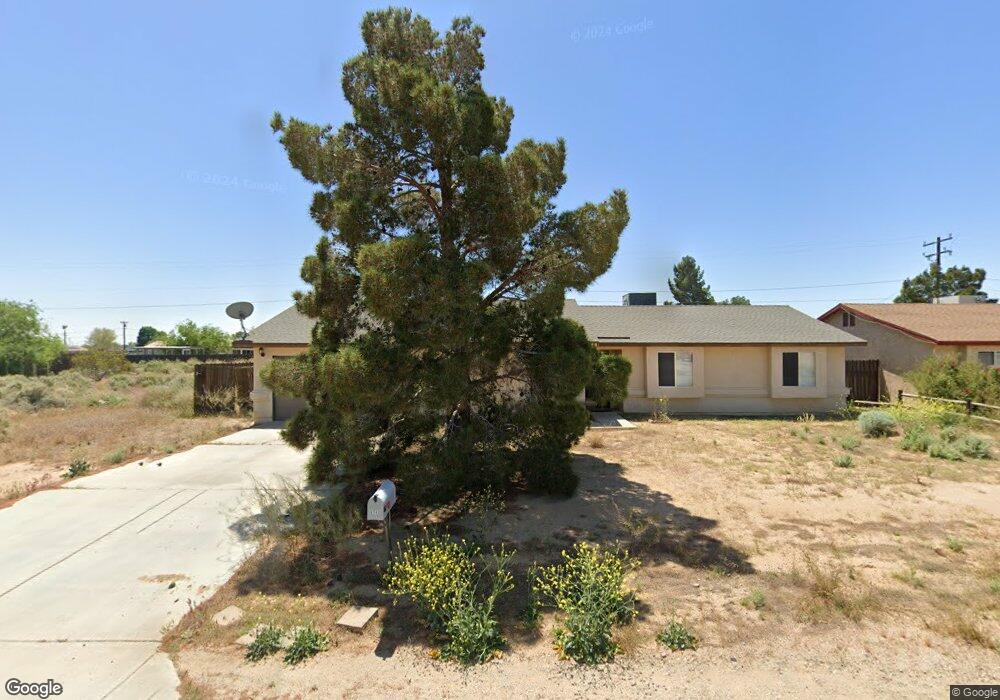
8540 Nipa Ave California City, CA 93505
Estimated Value: $187,000 - $249,000
3
Beds
2
Baths
1,320
Sq Ft
$173/Sq Ft
Est. Value
About This Home
This home is located at 8540 Nipa Ave, California City, CA 93505 and is currently estimated at $227,953, approximately $172 per square foot. 8540 Nipa Ave is a home located in Kern County with nearby schools including Robert P. Ulrich Elementary School, California City Middle School, and California City High School.
Ownership History
Date
Name
Owned For
Owner Type
Purchase Details
Closed on
Aug 9, 2019
Sold by
Gibson Diann and The Dan And Jo Ann Mixon Trust
Bought by
Brottlund Kyle
Current Estimated Value
Home Financials for this Owner
Home Financials are based on the most recent Mortgage that was taken out on this home.
Original Mortgage
$88,000
Outstanding Balance
$58,202
Interest Rate
3.8%
Mortgage Type
New Conventional
Estimated Equity
$169,751
Purchase Details
Closed on
Feb 4, 2011
Sold by
Morris Edie D
Bought by
Mixon Daniel G and Mixon Jo Ann
Purchase Details
Closed on
Jun 7, 1995
Sold by
Hud
Bought by
Morris Edie D
Home Financials for this Owner
Home Financials are based on the most recent Mortgage that was taken out on this home.
Original Mortgage
$47,111
Interest Rate
8.37%
Mortgage Type
FHA
Purchase Details
Closed on
Jan 6, 1995
Sold by
Fleet Mtg Corp
Bought by
Hud
Purchase Details
Closed on
Jan 5, 1995
Sold by
Maciel Erasmo R and Maciel Esperanza
Bought by
Fleet Mtg Corp
Create a Home Valuation Report for This Property
The Home Valuation Report is an in-depth analysis detailing your home's value as well as a comparison with similar homes in the area
Home Values in the Area
Average Home Value in this Area
Purchase History
| Date | Buyer | Sale Price | Title Company |
|---|---|---|---|
| Brottlund Kyle | $110,000 | First American Title | |
| Mixon Daniel G | $47,500 | Placer Title Company | |
| Morris Edie D | $47,500 | Heritage Title Company | |
| Hud | -- | Fidelity National Title Ins | |
| Fleet Mtg Corp | $85,068 | Fidelity National Title Ins |
Source: Public Records
Mortgage History
| Date | Status | Borrower | Loan Amount |
|---|---|---|---|
| Open | Brottlund Kyle | $88,000 | |
| Previous Owner | Morris Edie D | $47,111 |
Source: Public Records
Tax History Compared to Growth
Tax History
| Year | Tax Paid | Tax Assessment Tax Assessment Total Assessment is a certain percentage of the fair market value that is determined by local assessors to be the total taxable value of land and additions on the property. | Land | Improvement |
|---|---|---|---|---|
| 2025 | $1,632 | $120,297 | $21,871 | $98,426 |
| 2024 | $1,632 | $117,940 | $21,443 | $96,497 |
| 2023 | $1,540 | $115,628 | $21,023 | $94,605 |
| 2022 | $1,512 | $113,361 | $20,611 | $92,750 |
| 2021 | $1,492 | $111,139 | $20,207 | $90,932 |
| 2020 | $1,455 | $110,000 | $20,000 | $90,000 |
| 2019 | $904 | $55,638 | $5,854 | $49,784 |
| 2018 | $897 | $53,479 | $5,628 | $47,851 |
| 2017 | $903 | $52,431 | $5,518 | $46,913 |
| 2016 | $843 | $51,404 | $5,410 | $45,994 |
| 2015 | $845 | $50,633 | $5,329 | $45,304 |
| 2014 | $824 | $49,642 | $5,225 | $44,417 |
Source: Public Records
Map
Nearby Homes
- 8560 Lime Ave
- 22911206 85 85th St Unit 44
- 0 85th St Unit 25534459
- 0 85th St Unit CV21050043
- 0 86th St
- 9768 Nipa Ave
- 20325 87th St
- 8348 Lime Ave
- 20136 Medio St
- 0 87th St
- 0 84th St
- 0 Manzanita Ave Unit 25005062
- 8300 Jacaranda Ave
- 0 Medio St Unit HD24180415
- 0 St
- 8812 Nipa Ave
- 0 Ironwood Ave Ave
- 8313 Redwood Blvd
- 8600 Ironwood Ave
- 8139 Jacaranda Ave
- 8530 Nipa Ave
- 8531 Oleander Ave
- 8551 S Oleander Ave
- 8551 Oleander Ave
- 8560 Nipa Ave
- 8531 Nipa Ave
- 8521 Oleander Ave
- 8570 Nipa Ave
- 8561 Nipa Ave
- 8511 Oleander Ave
- 8540 Oleander Ave
- 8560 Oleander Ave
- 8581 Oleander Ave
- 8520 Oleander Ave
- 8437 Nipa Ave
- 8460 Manzanita Ave
- 0 85th St Unit CV18060738
- 0 85th St Unit CRCV21050043
- 0 85th St Unit 24-432411
- 0 85th St Unit 9990181