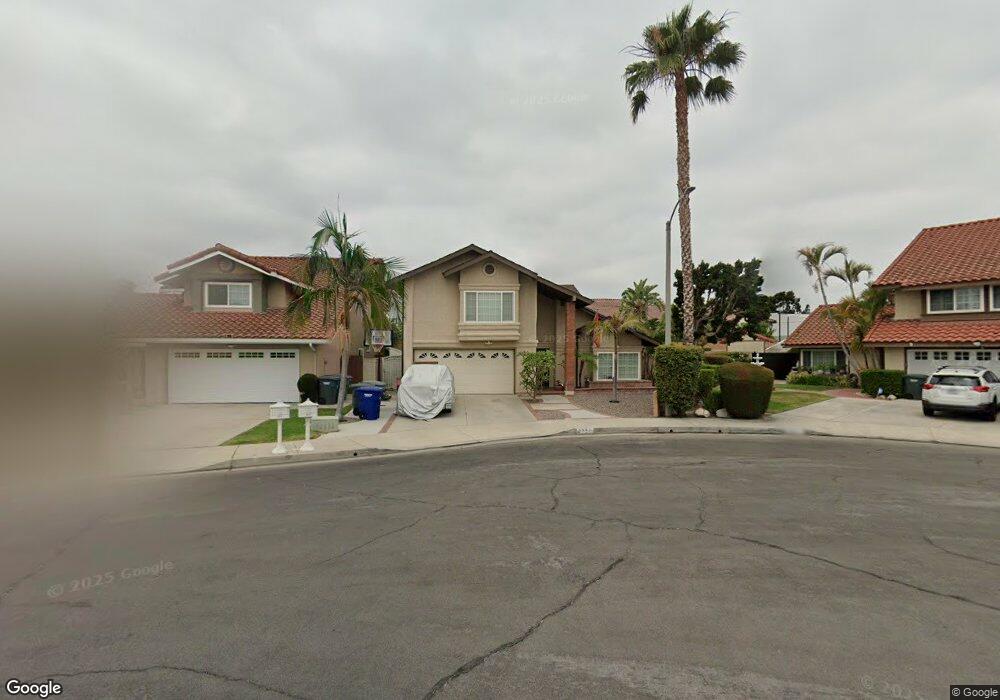
8549 Pinyon St Buena Park, CA 90620
Estimated Value: $993,000 - $1,159,000
4
Beds
3
Baths
2,082
Sq Ft
$513/Sq Ft
Est. Value
About This Home
This home is located at 8549 Pinyon St, Buena Park, CA 90620 and is currently estimated at $1,068,412, approximately $513 per square foot. 8549 Pinyon St is a home located in Orange County with nearby schools including Glen H. Dysinger Sr. Elementary School, Dale Jr High School, and Savanna High School.
Ownership History
Date
Name
Owned For
Owner Type
Purchase Details
Closed on
Dec 22, 2021
Sold by
Thienngern Jennifer C
Bought by
Jennifer C Thienngern Living Trust
Current Estimated Value
Purchase Details
Closed on
Oct 2, 2014
Sold by
Castro Jennifer
Bought by
Castro Jennifer and Theingen Chorm
Purchase Details
Closed on
Sep 4, 2014
Sold by
Oxy Usa Inc
Bought by
Vintage Petroleum Inc
Purchase Details
Closed on
Aug 1, 2014
Sold by
Castro Edelwina R
Bought by
Castro Jennifer
Purchase Details
Closed on
Jul 12, 2010
Sold by
Castro Edelwina R
Bought by
Castro Edelwina R and The Edelwina R Castro Living Trust
Purchase Details
Closed on
Oct 9, 1999
Sold by
Castro Guillermo G and Castro Edelwina R
Bought by
Castro Edelwina R
Create a Home Valuation Report for This Property
The Home Valuation Report is an in-depth analysis detailing your home's value as well as a comparison with similar homes in the area
Home Values in the Area
Average Home Value in this Area
Purchase History
| Date | Buyer | Sale Price | Title Company |
|---|---|---|---|
| Jennifer C Thienngern Living Trust | -- | None Listed On Document | |
| Thienngern Jennifer C | -- | None Listed On Document | |
| Castro Jennifer | -- | None Available | |
| Vintage Petroleum Inc | -- | None Available | |
| Castro Jennifer | -- | None Available | |
| Castro Edelwina R | -- | None Available | |
| Castro Edelwina R | -- | -- |
Source: Public Records
Tax History Compared to Growth
Tax History
| Year | Tax Paid | Tax Assessment Tax Assessment Total Assessment is a certain percentage of the fair market value that is determined by local assessors to be the total taxable value of land and additions on the property. | Land | Improvement |
|---|---|---|---|---|
| 2025 | $7,670 | $677,839 | $475,865 | $201,974 |
| 2024 | $7,670 | $664,549 | $466,535 | $198,014 |
| 2023 | $7,481 | $651,519 | $457,387 | $194,132 |
| 2022 | $7,389 | $638,745 | $448,419 | $190,326 |
| 2021 | $7,283 | $626,221 | $439,626 | $186,595 |
| 2020 | $7,242 | $619,800 | $435,118 | $184,682 |
| 2019 | $7,056 | $607,648 | $426,587 | $181,061 |
| 2018 | $6,927 | $595,734 | $418,223 | $177,511 |
| 2017 | $6,705 | $584,053 | $410,022 | $174,031 |
| 2016 | $6,576 | $572,601 | $401,982 | $170,619 |
| 2015 | $6,504 | $564,000 | $395,943 | $168,057 |
| 2014 | $3,412 | $294,841 | $107,645 | $187,196 |
Source: Public Records
Map
Nearby Homes
- 8452 Stanton Ave
- 7950 Jackson Way
- 2955 W Lincoln Ave Unit 7
- 3053 W Coolidge Ave
- 7720 Crescent Ave
- 2871 W Tyler Ave
- 2943 W Lincoln Ave
- 109 S Laxore St
- Plan Two at Mason
- Plan Four at Mason
- Plan Three at Mason
- Plan Seven at Mason
- 103 S Laxore St
- 106 S Laxore St Unit 407
- 107 S Laxore St
- 8319 Hickory Dr
- 3131 W Polk Ave
- 7545 Jackson Way
- 400 N Syracuse St
- 211 S Beach Blvd Unit 92
- 8551 Pinyon St
- 8127 Pinyon St
- 8563 Pinyon St
- 8133 Pinyon St
- 8575 Pinyon St
- 8139 Pinyon St
- 8550 Pinyon St
- 8560 Stanton Ave
- 8562 Stanton Ave
- 8570 Corsica Ln
- 8570 Stanton Ave
- 8569 Corsica Ln
- 8562 Pinyon St
- 8587 Pinyon St
- 8145 Pinyon St
- 8565 Corsica Ln Unit 9
- 8574 Pinyon St
- 8599 Pinyon St
- 8151 Pinyon St
- 8586 Pinyon St