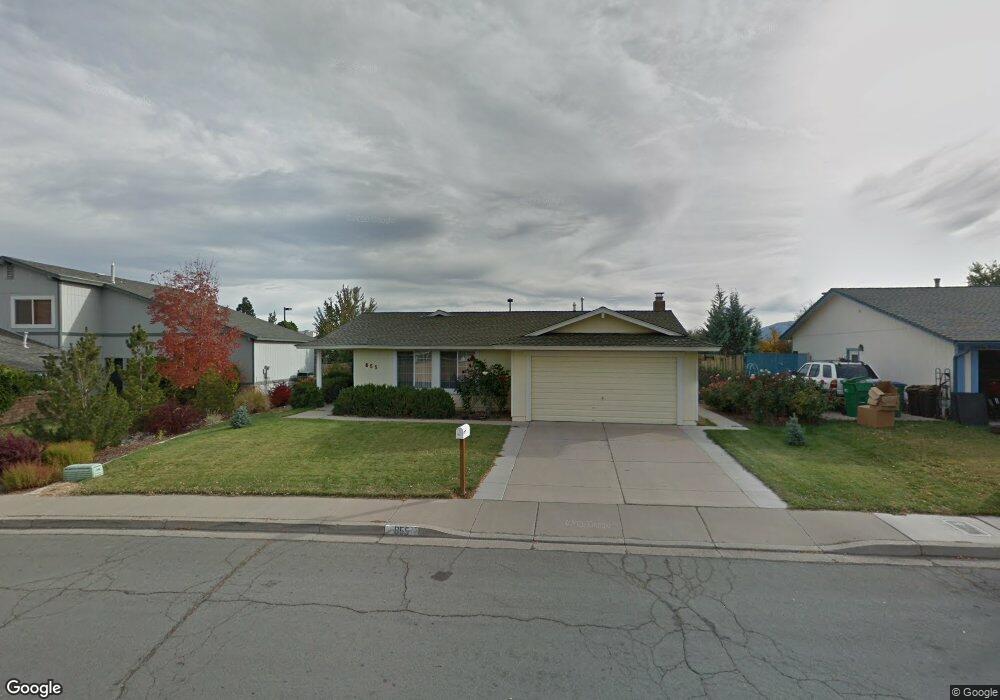
855 Emerson Way Sparks, NV 89431
North Rock NeighborhoodEstimated Value: $458,722 - $468,000
3
Beds
2
Baths
1,428
Sq Ft
$323/Sq Ft
Est. Value
About This Home
This home is located at 855 Emerson Way, Sparks, NV 89431 and is currently estimated at $461,681, approximately $323 per square foot. 855 Emerson Way is a home located in Washoe County with nearby schools including Alice Maxwell Elementary School, Sparks Middle School, and Sparks High School.
Ownership History
Date
Name
Owned For
Owner Type
Purchase Details
Closed on
Apr 2, 2003
Sold by
Burwick Caron L and Clippard James
Bought by
King Norman A
Current Estimated Value
Home Financials for this Owner
Home Financials are based on the most recent Mortgage that was taken out on this home.
Original Mortgage
$135,000
Outstanding Balance
$57,100
Interest Rate
5.54%
Estimated Equity
$404,581
Purchase Details
Closed on
Jun 16, 1999
Sold by
First Bank National Corp
Bought by
Burwick Caron L
Home Financials for this Owner
Home Financials are based on the most recent Mortgage that was taken out on this home.
Original Mortgage
$96,800
Interest Rate
7.05%
Purchase Details
Closed on
Aug 31, 1998
Sold by
Ferguson Everett William and Ferguson Linda Ann
Bought by
First Bank National Corp and Home Equity Loan Trust 1997-1
Create a Home Valuation Report for This Property
The Home Valuation Report is an in-depth analysis detailing your home's value as well as a comparison with similar homes in the area
Home Values in the Area
Average Home Value in this Area
Purchase History
| Date | Buyer | Sale Price | Title Company |
|---|---|---|---|
| King Norman A | $168,900 | Stewart Title Of Northern Nv | |
| Burwick Caron L | $121,000 | Stewart Title Company | |
| First Bank National Corp | $128,260 | First American Title Co |
Source: Public Records
Mortgage History
| Date | Status | Borrower | Loan Amount |
|---|---|---|---|
| Open | King Norman A | $135,000 | |
| Previous Owner | Burwick Caron L | $96,800 |
Source: Public Records
Tax History Compared to Growth
Tax History
| Year | Tax Paid | Tax Assessment Tax Assessment Total Assessment is a certain percentage of the fair market value that is determined by local assessors to be the total taxable value of land and additions on the property. | Land | Improvement |
|---|---|---|---|---|
| 2025 | $1,489 | $60,889 | $35,875 | $25,014 |
| 2024 | $1,489 | $61,836 | $35,875 | $25,961 |
| 2023 | $1,080 | $61,788 | $36,540 | $25,248 |
| 2022 | $1,404 | $50,549 | $28,980 | $21,569 |
| 2021 | $1,364 | $44,209 | $22,225 | $21,984 |
| 2020 | $1,322 | $44,748 | $22,225 | $22,523 |
| 2019 | $1,284 | $43,551 | $21,280 | $22,271 |
| 2018 | $1,246 | $37,832 | $15,610 | $22,222 |
| 2017 | $1,210 | $36,108 | $13,440 | $22,668 |
| 2016 | $1,179 | $36,147 | $12,600 | $23,547 |
| 2015 | $591 | $35,648 | $11,725 | $23,923 |
| 2014 | $1,143 | $31,189 | $7,770 | $23,419 |
| 2013 | -- | $30,563 | $7,140 | $23,423 |
Source: Public Records
Map
Nearby Homes
- 780 Emerson Way
- 3252 Holman Way
- 3269 Valley Forge Way
- 465 Lenwood Dr
- 1125 Dodson Way
- 5530 High Rock Way
- 0 N Mccarran Blvd Unit 250052909
- 1160 York Way
- 1345 Plymouth Way
- 1110 Xman Way
- 3465 Dawn Cir
- 119 Devere Way
- 1023 Tyler Way
- 3245 Elaine Way
- 3607 Keogh Dr
- 3545 4th St
- 1595 York Way
- 1945 4th St Unit 32
- 1945 4th St Unit 33
- 1945 4th St Unit 10
- 835 Emerson Way
- 885 Emerson Way
- 905 Emerson Way
- 3200 Wilma Dr
- 3175 Lagomarsino Dr
- 3185 Lagomarsino Dr
- 915 Emerson Way
- 3210 Wilma Dr
- 3205 Wilma Dr
- 3211 Lagomarsino Dr
- 3215 Wilma Dr
- 925 Emerson Way
- 3220 Wilma Dr
- 3170 Lagomarsino Dr
- 3221 Lagomarsino Dr
- 3202 Bunker Hill Ln
- 3180 Lagomarsino Dr
- 3225 Wilma Dr
- 3190 Lagomarsino Dr
- 3230 Wilma Dr