855 Lakeview Dr Redding, CA 96001
Lakeview NeighborhoodEstimated Value: $182,401 - $269,000
2
Beds
1
Bath
1,044
Sq Ft
$225/Sq Ft
Est. Value
About This Home
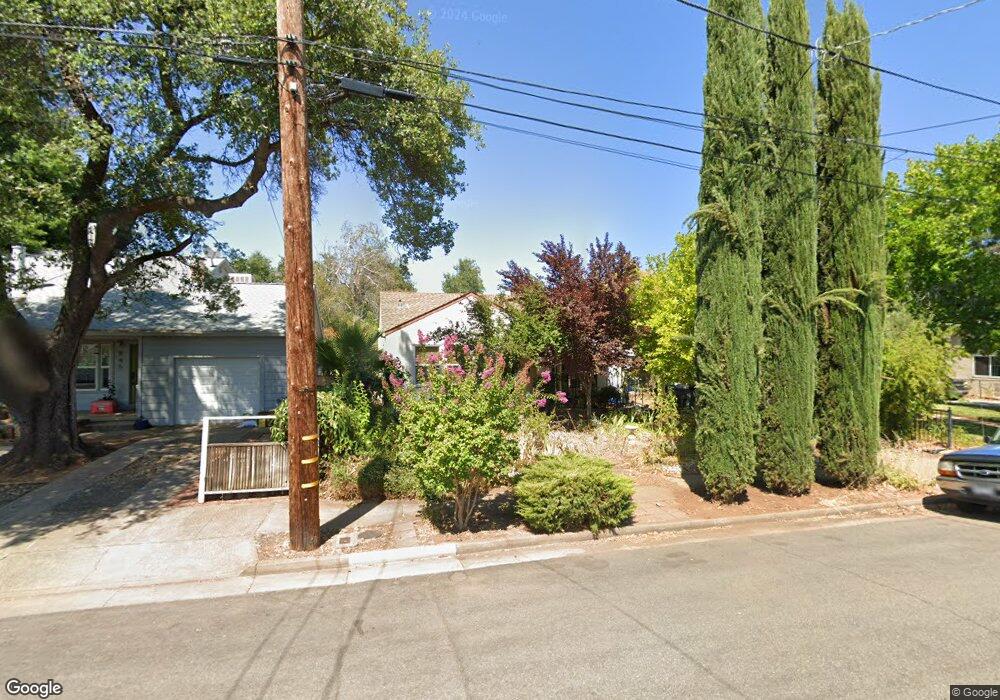
This home is located at 855 Lakeview Dr, Redding, CA 96001 and is currently estimated at $234,850, approximately $224 per square foot. 855 Lakeview Dr is a home located in Shasta County with nearby schools including Manzanita Elementary School, Sequoia Middle School, and Shasta High School.
Ownership History
Date
Name
Owned For
Owner Type
Purchase Details
Closed on
Oct 11, 2005
Sold by
Stranahan Sally L
Bought by
Stranahan Sally L and Stranahan Jay S
Current Estimated Value
Purchase Details
Closed on
May 23, 2002
Sold by
Stranahan Jay
Bought by
Stranahan Sally L
Purchase Details
Closed on
Jun 6, 2000
Sold by
Stranahan Charles M
Bought by
Stranahan Jay
Home Financials for this Owner
Home Financials are based on the most recent Mortgage that was taken out on this home.
Original Mortgage
$30,000
Interest Rate
8.15%
Mortgage Type
Seller Take Back
Create a Home Valuation Report for This Property
The Home Valuation Report is an in-depth analysis detailing your home's value as well as a comparison with similar homes in the area
Home Values in the Area
Average Home Value in this Area
Purchase History
| Date | Buyer | Sale Price | Title Company |
|---|---|---|---|
| Stranahan Sally L | -- | None Listed On Document | |
| Stranahan Sally L | -- | -- | |
| Stranahan Jay | $30,000 | Fidelity National Title Co |
Source: Public Records
Mortgage History
| Date | Status | Borrower | Loan Amount |
|---|---|---|---|
| Previous Owner | Stranahan Jay | $30,000 |
Source: Public Records
Tax History
| Year | Tax Paid | Tax Assessment Tax Assessment Total Assessment is a certain percentage of the fair market value that is determined by local assessors to be the total taxable value of land and additions on the property. | Land | Improvement |
|---|---|---|---|---|
| 2025 | $406 | $42,862 | $13,462 | $29,400 |
| 2024 | $398 | $42,023 | $13,199 | $28,824 |
| 2023 | $398 | $41,200 | $12,941 | $28,259 |
| 2022 | $389 | $40,393 | $12,688 | $27,705 |
| 2021 | $385 | $39,602 | $12,440 | $27,162 |
| 2020 | $388 | $39,197 | $12,313 | $26,884 |
| 2019 | $368 | $38,429 | $12,072 | $26,357 |
| 2018 | $369 | $37,677 | $11,836 | $25,841 |
| 2017 | $365 | $36,939 | $11,604 | $25,335 |
| 2016 | $352 | $36,216 | $11,377 | $24,839 |
| 2015 | $347 | $35,673 | $11,207 | $24,466 |
| 2014 | $343 | $34,975 | $10,988 | $23,987 |
Source: Public Records
Map
Nearby Homes
- 1066 Pine St
- 2350 Amethyst Way
- 2565 North St
- 2520 Snow Ln
- 1833 Del Mar Ave
- 1191 Hillcrest Place
- 1545 Olive Ave
- 837 Coronado St
- 418 Moonstone Way
- 805 Christine Ave
- 1569 Walnut Ave
- 1575 Fig Ave
- 1025 Chardonnay Walk
- 531 Aurora Place
- 1777 Magnolia Ave
- 686 Coronado St
- 582 River Oaks Dr
- 0 California St Unit 25-5331
- 3024 West St
- 2381/2401 West St
- 865 Lakeview Dr
- 845 Lakeview Dr
- 875 Lakeview Dr
- 835 Lakeview Dr
- 885 Lakeview Dr
- 852 Lakeview Dr
- 860 Lakeview Dr
- 815 Lakeview Dr
- 874 Lakeview Dr
- 840 Lakeview Dr
- 834 Lakeview Dr
- 895 Lakeview Dr
- 820 Lakeview Dr
- 810 Lakeview Dr
- 801 Lakeview Dr
- 1810 9th St
- 1805 9th St
- 804 Lakeview Dr
- 1835 8th St
- 1815 9th St
Your Personal Tour Guide
Ask me questions while you tour the home.