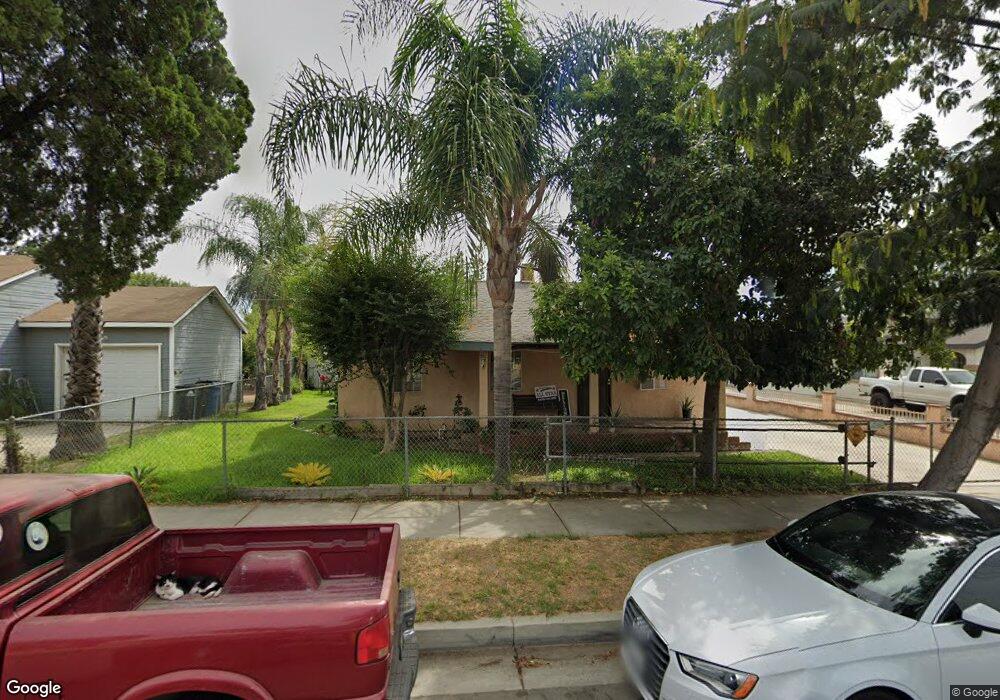
855 S Oaks Ave Ontario, CA 91762
Downtown Ontario NeighborhoodEstimated Value: $532,000 - $729,000
2
Beds
1
Bath
924
Sq Ft
$687/Sq Ft
Est. Value
About This Home
This home is located at 855 S Oaks Ave, Ontario, CA 91762 and is currently estimated at $635,014, approximately $687 per square foot. 855 S Oaks Ave is a home located in San Bernardino County with nearby schools including Mission Elementary School, Oaks Middle, and Ontario High School.
Ownership History
Date
Name
Owned For
Owner Type
Purchase Details
Closed on
Apr 9, 2007
Sold by
Garcia Jose
Bought by
Garcia Jose and Huerta Jose
Current Estimated Value
Purchase Details
Closed on
Aug 30, 2003
Sold by
Priego Carlos Armando
Bought by
Garcia Jose
Home Financials for this Owner
Home Financials are based on the most recent Mortgage that was taken out on this home.
Original Mortgage
$165,750
Outstanding Balance
$76,521
Interest Rate
6.17%
Mortgage Type
Purchase Money Mortgage
Estimated Equity
$558,493
Purchase Details
Closed on
Feb 24, 1995
Sold by
Priego Candida Garcia
Bought by
Priego Carlos Armando
Home Financials for this Owner
Home Financials are based on the most recent Mortgage that was taken out on this home.
Original Mortgage
$68,800
Interest Rate
9.21%
Purchase Details
Closed on
Jan 9, 1995
Sold by
Mistretta Frank J
Bought by
Priego Carlos Armando and Garcia Jose
Home Financials for this Owner
Home Financials are based on the most recent Mortgage that was taken out on this home.
Original Mortgage
$68,800
Interest Rate
9.21%
Create a Home Valuation Report for This Property
The Home Valuation Report is an in-depth analysis detailing your home's value as well as a comparison with similar homes in the area
Home Values in the Area
Average Home Value in this Area
Purchase History
| Date | Buyer | Sale Price | Title Company |
|---|---|---|---|
| Garcia Jose | -- | None Available | |
| Garcia Jose | -- | Gateway Title | |
| Priego Carlos Armando | -- | Commonwealth Land Title | |
| Priego Carlos Armando | $86,000 | Commonwealth Land Title |
Source: Public Records
Mortgage History
| Date | Status | Borrower | Loan Amount |
|---|---|---|---|
| Open | Garcia Jose | $165,750 | |
| Previous Owner | Priego Carlos Armando | $68,800 | |
| Closed | Priego Carlos Armando | $14,900 |
Source: Public Records
Tax History Compared to Growth
Tax History
| Year | Tax Paid | Tax Assessment Tax Assessment Total Assessment is a certain percentage of the fair market value that is determined by local assessors to be the total taxable value of land and additions on the property. | Land | Improvement |
|---|---|---|---|---|
| 2025 | $3,041 | $282,113 | $122,501 | $159,612 |
| 2024 | $3,041 | $276,581 | $120,099 | $156,482 |
| 2023 | $2,956 | $271,158 | $117,744 | $153,414 |
| 2022 | $2,917 | $265,841 | $115,435 | $150,406 |
| 2021 | $2,899 | $260,629 | $113,172 | $147,457 |
| 2020 | $2,848 | $257,957 | $112,012 | $145,945 |
| 2019 | $2,824 | $252,899 | $109,816 | $143,083 |
| 2018 | $2,893 | $247,940 | $107,663 | $140,277 |
| 2017 | $2,685 | $243,078 | $105,552 | $137,526 |
| 2016 | $2,579 | $238,311 | $103,482 | $134,829 |
| 2015 | $2,562 | $234,732 | $101,928 | $132,804 |
| 2014 | $2,802 | $230,134 | $99,931 | $130,203 |
Source: Public Records
Map
Nearby Homes
- 1325 W Ralston St
- 1309 W Mission Blvd Unit 59
- 1411 W Mission Blvd
- 890 S Magnolia Ave
- 1511 W Mission Blvd
- 1007 S Magnolia Ave
- 1020 S Mountain Ave
- 829 S Mountain Ave
- 831 S Mountain Ave Unit 6
- 863 S Mountain Ave Unit 22
- 1052 W Ralston St
- 920 S Palmetto Ave Unit 9
- 1209 S Palmetto Ave Unit C
- 1031 S Palmetto Ave Unit N9
- 1031 S Palmetto Ave Unit W8
- 1031 S Palmetto Ave Unit II3
- 1031 S Palmetto Ave Unit N1
- 842 Carlton Privado
- 850 W Mission Blvd
- 850 W Mission Blvd Unit A46
- 861 S Oaks Ave
- 847 S Oaks Ave Unit 13
- 1352 W Maitland St
- 835 S Oaks Ave
- 835 S Oaks Ave
- 1382 W Maitland St
- 915 S Oaks Ave
- 1342 W Maitland St
- 844 S Oaks Ave
- 856 S Oaks Ave
- 904 S Oaks Ave
- 1332 W Maitland St
- 1381 W Maitland St
- 848 S Oaks Ave
- 839 S Oaks Ave Unit D
- 839 S Oaks Ave
- 839 S Oaks Ave
- 839 S Oaks Ave Unit C
- 839 S Oaks Ave Unit A
- 1351 W Maitland St