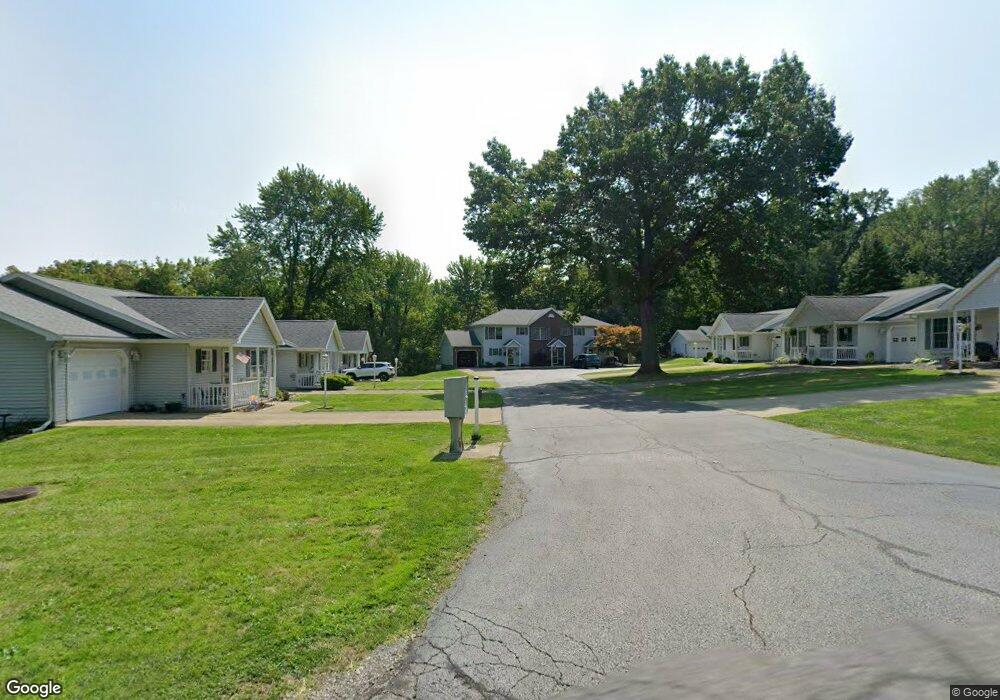
855 Spring St Unit S8 Conneaut, OH 44030
Estimated Value: $139,000 - $162,000
2
Beds
2
Baths
1,120
Sq Ft
$137/Sq Ft
Est. Value
About This Home
This home is located at 855 Spring St Unit S8, Conneaut, OH 44030 and is currently estimated at $153,900, approximately $137 per square foot. 855 Spring St Unit S8 is a home located in Ashtabula County with nearby schools including Lakeshore Primary Elementary School, Gateway Elementary School, and Conneaut Middle School.
Ownership History
Date
Name
Owned For
Owner Type
Purchase Details
Closed on
Aug 15, 2022
Sold by
Zappitelli Michael A
Bought by
Duris Alicia N
Current Estimated Value
Home Financials for this Owner
Home Financials are based on the most recent Mortgage that was taken out on this home.
Original Mortgage
$110,101
Outstanding Balance
$105,419
Interest Rate
5.7%
Mortgage Type
New Conventional
Estimated Equity
$48,481
Purchase Details
Closed on
May 24, 2013
Sold by
Conneaut Savings Bank
Bought by
Zappitelli Michael A
Home Financials for this Owner
Home Financials are based on the most recent Mortgage that was taken out on this home.
Original Mortgage
$58,000
Interest Rate
2.58%
Mortgage Type
New Conventional
Purchase Details
Closed on
Dec 29, 2000
Sold by
Nvr Homes Inc
Bought by
Mcvoy Ronald and Mcvoy Barbara
Create a Home Valuation Report for This Property
The Home Valuation Report is an in-depth analysis detailing your home's value as well as a comparison with similar homes in the area
Home Values in the Area
Average Home Value in this Area
Purchase History
| Date | Buyer | Sale Price | Title Company |
|---|---|---|---|
| Duris Alicia N | $109,000 | Title Professionals Group | |
| Zappitelli Michael A | $58,000 | Venture Title | |
| Mcvoy Ronald | $78,800 | -- |
Source: Public Records
Mortgage History
| Date | Status | Borrower | Loan Amount |
|---|---|---|---|
| Open | Duris Alicia N | $110,101 | |
| Previous Owner | Zappitelli Michael A | $58,000 |
Source: Public Records
Tax History
| Year | Tax Paid | Tax Assessment Tax Assessment Total Assessment is a certain percentage of the fair market value that is determined by local assessors to be the total taxable value of land and additions on the property. | Land | Improvement |
|---|---|---|---|---|
| 2024 | $2,668 | $36,470 | $6,160 | $30,310 |
| 2023 | $1,694 | $36,470 | $6,160 | $30,310 |
| 2022 | $1,558 | $28,990 | $4,730 | $24,260 |
| 2021 | $1,584 | $28,990 | $4,730 | $24,260 |
| 2020 | $1,583 | $28,990 | $4,730 | $24,260 |
| 2019 | $1,262 | $22,650 | $4,730 | $17,920 |
| 2018 | $1,204 | $22,650 | $4,730 | $17,920 |
| 2017 | $1,159 | $22,650 | $4,730 | $17,920 |
| 2016 | $1,105 | $22,650 | $4,730 | $17,920 |
| 2015 | $1,116 | $22,650 | $4,730 | $17,920 |
| 2014 | $988 | $22,650 | $4,730 | $17,920 |
| 2013 | $1,126 | $26,570 | $4,450 | $22,120 |
Source: Public Records
Map
Nearby Homes
- 855 Spring St Unit S9
- 238 Whitney St
- 745 Maple Ave
- 110 Edgewood Dr
- 681 Madison St
- 18 Hillcrest Ct
- 536 Madison St
- 475 State St
- 474 Sherman St
- 210 W Main Rd
- VL Center Rd
- 202 W Main Rd Unit 132
- 375 Bliss Ave
- 166 Welton Rd
- 404 Viaduct St
- 555 Wrights Ave
- 450 Buffalo St
- 220 Daniels Ave
- 0 Dorman Rd
- 386 Washington St
- 855 Spring St Unit S11
- 855 Spring St Unit S10
- 855 Spring St Unit S7
- 855 Spring St Unit S6
- 855 Spring St Unit S5
- 855 Spring St Unit S3
- 855 Spring St Unit S2
- 855 Spring St Unit S1
- 855 Spring St Unit S12
- 855 Spring St Unit 7
- 855 Spring St Unit 8
- 855 Spring St Unit 1
- 855 Spring St Unit N-3
- 861 Spring St
- 856 Spring St
- 114 Grandview Ave
- 138 Grandview St
- 136 Grandview St
- 844 Spring St Unit N2
- 844 Spring St Unit N1
Your Personal Tour Guide
Ask me questions while you tour the home.