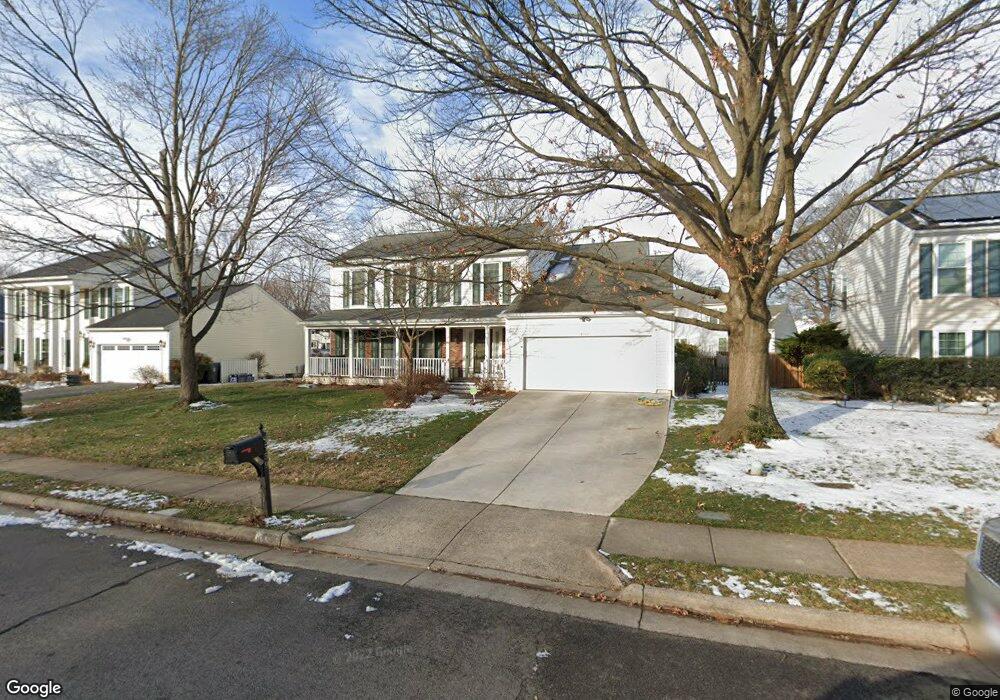
8559 Yoder St Manassas, VA 20110
Old Town Manassas NeighborhoodEstimated Value: $657,491 - $708,000
4
Beds
3
Baths
2,420
Sq Ft
$284/Sq Ft
Est. Value
About This Home
This home is located at 8559 Yoder St, Manassas, VA 20110 and is currently estimated at $687,873, approximately $284 per square foot. 8559 Yoder St is a home located in Manassas City with nearby schools including Baldwin Elementary School, Mayfield Intermediate School, and Grace E. Metz Middle School.
Ownership History
Date
Name
Owned For
Owner Type
Purchase Details
Closed on
Mar 19, 2021
Sold by
Nagelin Michael P and Trautwein Elaine H
Bought by
Trautwein Elaine H
Current Estimated Value
Purchase Details
Closed on
Jun 26, 1998
Sold by
Campbell William S and Campbell Deborah S
Bought by
Nagelin Michael P and Nagelin Isabel A
Home Financials for this Owner
Home Financials are based on the most recent Mortgage that was taken out on this home.
Original Mortgage
$198,635
Outstanding Balance
$37,674
Interest Rate
7.09%
Mortgage Type
VA
Estimated Equity
$650,199
Create a Home Valuation Report for This Property
The Home Valuation Report is an in-depth analysis detailing your home's value as well as a comparison with similar homes in the area
Home Values in the Area
Average Home Value in this Area
Purchase History
| Date | Buyer | Sale Price | Title Company |
|---|---|---|---|
| Trautwein Elaine H | -- | None Available | |
| Nagelin Michael P | $206,000 | -- |
Source: Public Records
Mortgage History
| Date | Status | Borrower | Loan Amount |
|---|---|---|---|
| Open | Nagelin Michael P | $198,635 |
Source: Public Records
Tax History
| Year | Tax Paid | Tax Assessment Tax Assessment Total Assessment is a certain percentage of the fair market value that is determined by local assessors to be the total taxable value of land and additions on the property. | Land | Improvement |
|---|---|---|---|---|
| 2025 | $7,376 | $585,400 | $175,000 | $410,400 |
| 2024 | $7,376 | $561,500 | $175,000 | $386,500 |
| 2023 | $6,951 | $551,700 | $170,000 | $381,700 |
| 2022 | $6,693 | $498,700 | $148,000 | $350,700 |
| 2021 | $6,112 | $427,700 | $132,000 | $295,700 |
| 2020 | $5,795 | $396,900 | $127,500 | $269,400 |
| 2019 | $5,665 | $382,800 | $124,000 | $258,800 |
| 2018 | $5,376 | $368,200 | $118,000 | $250,200 |
| 2017 | -- | $360,900 | $118,000 | $242,900 |
| 2016 | $4,974 | $354,500 | $0 | $0 |
| 2015 | -- | $348,600 | $118,000 | $230,600 |
| 2014 | -- | $0 | $0 | $0 |
Source: Public Records
Map
Nearby Homes
- 8510 Clearridge Ln
- 9508 Lehr Ct
- 8591 Signal Hill Rd
- 8600 Sanderling Dr
- 8191 Lone Oak Ct
- 8600 Liberty Trail Unit 102
- 8463 Crozier Ct Unit 104
- 8770 Deblanc Place
- 9576 Jayhawk Terrace Unit 301
- 8374 Buttress Ln Unit 202
- 8383 Buttress Ln Unit 302
- 10140 Forest Hill Cir
- 10274 Racquet Cir
- 9553 Battery Heights Blvd Unit 303
- 8261 Knight Station Way
- 10283 Long Hill Ct
- 7910 Guy Dr
- 7809 Signal Hill Rd
- 8956 Center St
- 8941 Quarry Rd
Your Personal Tour Guide
Ask me questions while you tour the home.