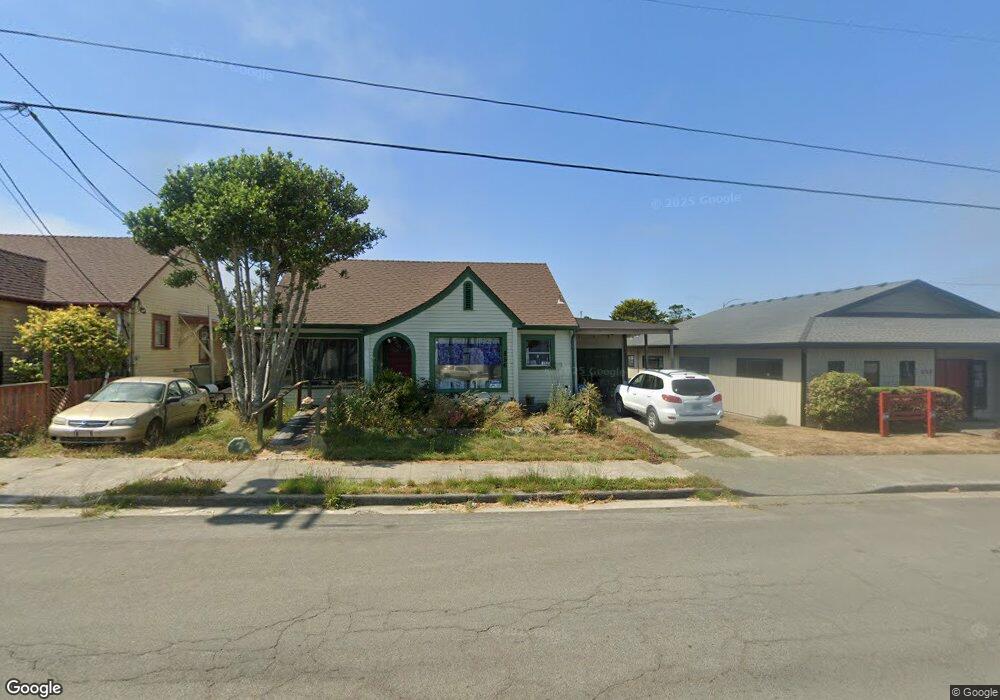
856 4th St Crescent City, CA 95531
Estimated Value: $215,000 - $238,000
2
Beds
1
Bath
892
Sq Ft
$254/Sq Ft
Est. Value
About This Home
This home is located at 856 4th St, Crescent City, CA 95531 and is currently estimated at $226,382, approximately $253 per square foot. 856 4th St is a home located in Del Norte County with nearby schools including Joe Hamilton Elementary School, Crescent Elk Middle School, and Del Norte High School.
Ownership History
Date
Name
Owned For
Owner Type
Purchase Details
Closed on
Oct 12, 2021
Sold by
Moore Donald and Moore Sarah
Bought by
Manley Susan
Current Estimated Value
Home Financials for this Owner
Home Financials are based on the most recent Mortgage that was taken out on this home.
Original Mortgage
$157,500
Outstanding Balance
$143,792
Interest Rate
2.88%
Mortgage Type
New Conventional
Estimated Equity
$82,590
Purchase Details
Closed on
Oct 3, 2018
Sold by
Cole Constance S
Bought by
Moore Donald and Moore Sarah
Purchase Details
Closed on
Apr 1, 2016
Sold by
Cole Constance S
Bought by
Cole Constance S
Create a Home Valuation Report for This Property
The Home Valuation Report is an in-depth analysis detailing your home's value as well as a comparison with similar homes in the area
Home Values in the Area
Average Home Value in this Area
Purchase History
| Date | Buyer | Sale Price | Title Company |
|---|---|---|---|
| Manley Susan | $175,000 | First American Title Company | |
| Moore Donald | $92,500 | Crescent Land Title | |
| Cole Constance S | -- | None Available | |
| Cole Constance S | -- | None Available |
Source: Public Records
Mortgage History
| Date | Status | Borrower | Loan Amount |
|---|---|---|---|
| Open | Manley Susan | $157,500 |
Source: Public Records
Tax History
| Year | Tax Paid | Tax Assessment Tax Assessment Total Assessment is a certain percentage of the fair market value that is determined by local assessors to be the total taxable value of land and additions on the property. | Land | Improvement |
|---|---|---|---|---|
| 2025 | $1,984 | $185,711 | $47,754 | $137,957 |
| 2024 | $1,904 | $182,070 | $46,818 | $135,252 |
| 2023 | $1,863 | $178,500 | $45,900 | $132,600 |
| 2022 | $1,823 | $175,000 | $45,000 | $130,000 |
| 2021 | $1,007 | $95,326 | $41,222 | $54,104 |
| 2020 | $1,000 | $94,350 | $40,800 | $53,550 |
| 2019 | $620 | $58,366 | $31,836 | $26,530 |
| 2018 | $608 | $57,222 | $31,212 | $26,010 |
| 2017 | $215 | $56,100 | $30,600 | $25,500 |
| 2016 | $212 | $19,821 | $7,029 | $12,792 |
| 2015 | $207 | $19,524 | $6,924 | $12,600 |
| 2014 | $205 | $19,143 | $6,789 | $12,354 |
Source: Public Records
Map
Nearby Homes
Your Personal Tour Guide
Ask me questions while you tour the home.