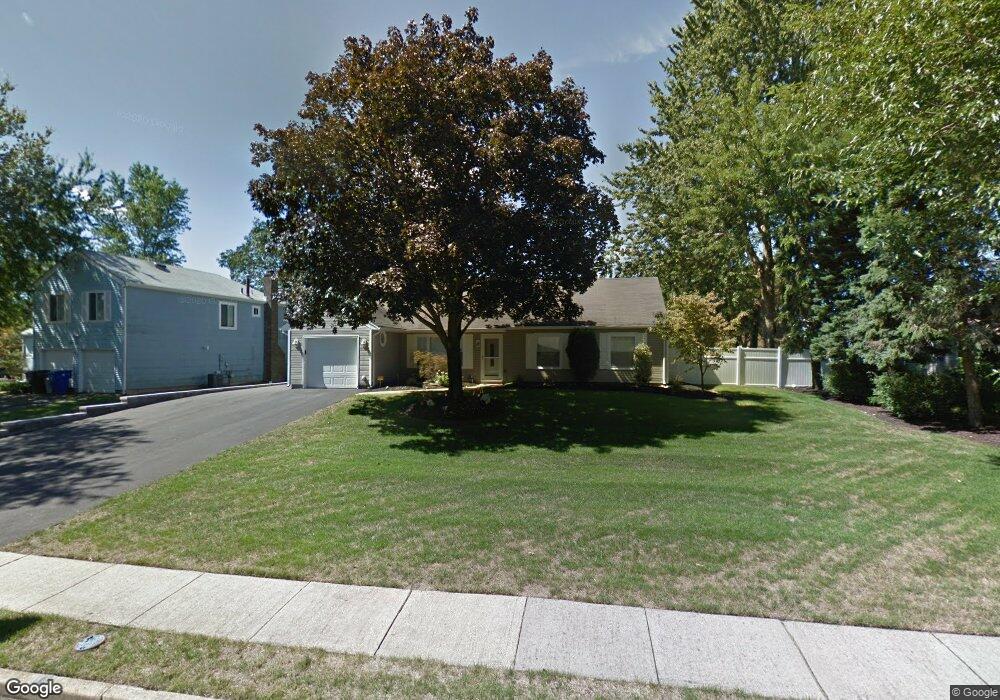
856 Devonshire Rd Toms River, NJ 08753
Estimated Value: $449,725 - $546,000
3
Beds
1
Bath
1,428
Sq Ft
$343/Sq Ft
Est. Value
About This Home
This home is located at 856 Devonshire Rd, Toms River, NJ 08753 and is currently estimated at $489,681, approximately $342 per square foot. 856 Devonshire Rd is a home located in Ocean County with nearby schools including St Joseph Grade School and Donovan Catholic High School.
Ownership History
Date
Name
Owned For
Owner Type
Purchase Details
Closed on
Jan 31, 2014
Sold by
Seaman Sonja
Bought by
Seaman Everett H
Current Estimated Value
Home Financials for this Owner
Home Financials are based on the most recent Mortgage that was taken out on this home.
Original Mortgage
$197,500
Outstanding Balance
$54,065
Interest Rate
3.35%
Mortgage Type
New Conventional
Estimated Equity
$435,616
Purchase Details
Closed on
May 16, 2012
Sold by
Lynch Patrick
Bought by
Seaman Sonja
Purchase Details
Closed on
Oct 8, 2002
Sold by
Sanci Jenny
Bought by
Lynch Patrick
Home Financials for this Owner
Home Financials are based on the most recent Mortgage that was taken out on this home.
Original Mortgage
$186,750
Interest Rate
6.07%
Purchase Details
Closed on
Feb 28, 2001
Sold by
Benishti Haimn
Bought by
Sanci Jenny
Home Financials for this Owner
Home Financials are based on the most recent Mortgage that was taken out on this home.
Original Mortgage
$125,000
Interest Rate
7%
Create a Home Valuation Report for This Property
The Home Valuation Report is an in-depth analysis detailing your home's value as well as a comparison with similar homes in the area
Home Values in the Area
Average Home Value in this Area
Purchase History
| Date | Buyer | Sale Price | Title Company |
|---|---|---|---|
| Seaman Everett H | $250,000 | Coastine Title Agency Inc | |
| Seaman Sonja | $230,000 | Old Republic National Title | |
| Lynch Patrick | $207,500 | -- | |
| Sanci Jenny | $132,000 | -- | |
| Sanci Jenny | $132,000 | -- |
Source: Public Records
Mortgage History
| Date | Status | Borrower | Loan Amount |
|---|---|---|---|
| Open | Seaman Everett H | $197,500 | |
| Previous Owner | Lynch Patrick | $186,750 | |
| Previous Owner | Sanci Jenny | $125,000 |
Source: Public Records
Tax History Compared to Growth
Tax History
| Year | Tax Paid | Tax Assessment Tax Assessment Total Assessment is a certain percentage of the fair market value that is determined by local assessors to be the total taxable value of land and additions on the property. | Land | Improvement |
|---|---|---|---|---|
| 2025 | $5,907 | $324,400 | $95,000 | $229,400 |
| 2024 | $5,615 | $324,400 | $95,000 | $229,400 |
| 2023 | $5,414 | $324,400 | $95,000 | $229,400 |
| 2022 | $5,414 | $324,400 | $95,000 | $229,400 |
| 2021 | $4,860 | $194,000 | $98,500 | $95,500 |
| 2020 | $4,838 | $194,000 | $98,500 | $95,500 |
| 2019 | $4,629 | $194,000 | $98,500 | $95,500 |
| 2018 | $4,567 | $194,000 | $98,500 | $95,500 |
| 2017 | $4,528 | $194,000 | $98,500 | $95,500 |
| 2016 | $4,410 | $194,000 | $98,500 | $95,500 |
| 2015 | $4,243 | $194,000 | $98,500 | $95,500 |
| 2014 | $4,039 | $194,000 | $98,500 | $95,500 |
Source: Public Records
Map
Nearby Homes
- 872 Devonshire Rd
- 1109 Carriage Ct
- 1052 Bell St
- 1097 Westlake Dr
- 1090 Westlake Dr
- 893 New Jersey Ave
- 5 Selena Place
- 1042 Roxbury Ln
- 912 New Jersey Ave
- 921 Tudor Dr
- 1181 Fischer Blvd
- 804 Neville St
- 786 Nebraska Ave
- 1099 Fairview Dr
- 779 Nebraska Ave
- 1013 Bay Ave
- 968 Goose Creek Rd
- 904 Nantucket Ct
- 948 Hazelwood Rd
- 956 Meredith Dr
- 860 Devonshire Rd
- 852 Devonshire Rd
- 857 Peppertree Dr
- 853 Peppertree Dr
- 861 Peppertree Dr
- 857 Devonshire Rd
- 864 Devonshire Rd
- 861 Devonshire Rd
- 853 Devonshire Rd
- 865 Devonshire Rd
- 1073 Bell St
- 1077 Bell St
- 868 Devonshire Rd
- 1069 Bell St
- 852 Peppertree Dr
- 869 Devonshire Rd
- 856 Tudor Ct
- 852 Tudor Ct
- 860 Tudor Ct
- 1081 Bell St