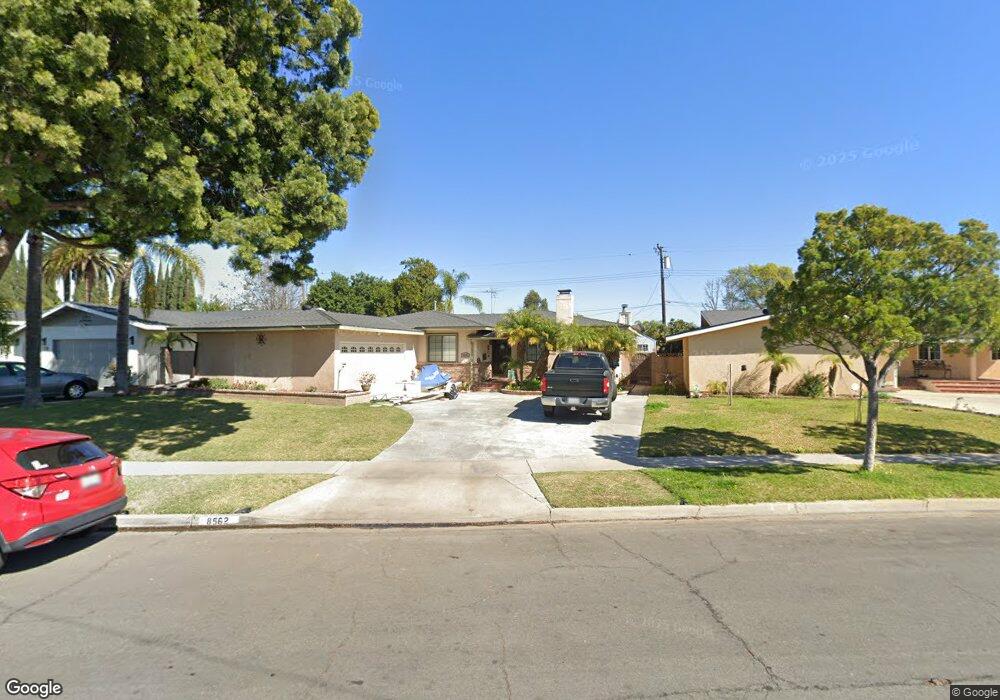
8562 Cedar Dr Buena Park, CA 90620
Estimated Value: $923,000 - $984,000
3
Beds
2
Baths
1,631
Sq Ft
$577/Sq Ft
Est. Value
About This Home
This home is located at 8562 Cedar Dr, Buena Park, CA 90620 and is currently estimated at $941,655, approximately $577 per square foot. 8562 Cedar Dr is a home located in Orange County with nearby schools including Glen H. Dysinger Sr. Elementary School, Dale Jr High School, and Savanna High School.
Ownership History
Date
Name
Owned For
Owner Type
Purchase Details
Closed on
Mar 25, 2021
Sold by
Rios Eric P and Rios Estela M
Bought by
Rios Eric P and Rios Estela M
Current Estimated Value
Home Financials for this Owner
Home Financials are based on the most recent Mortgage that was taken out on this home.
Original Mortgage
$287,500
Outstanding Balance
$259,014
Interest Rate
3%
Mortgage Type
New Conventional
Estimated Equity
$682,641
Purchase Details
Closed on
Sep 19, 1995
Sold by
Chun Sarah Yun E
Bought by
Chun Il Jong
Home Financials for this Owner
Home Financials are based on the most recent Mortgage that was taken out on this home.
Original Mortgage
$155,790
Interest Rate
7.88%
Mortgage Type
FHA
Purchase Details
Closed on
Aug 14, 1995
Sold by
Chun Se Jin and Chun Bok Sun
Bought by
Rios Eric and Rios Estela
Home Financials for this Owner
Home Financials are based on the most recent Mortgage that was taken out on this home.
Original Mortgage
$155,790
Interest Rate
7.88%
Mortgage Type
FHA
Create a Home Valuation Report for This Property
The Home Valuation Report is an in-depth analysis detailing your home's value as well as a comparison with similar homes in the area
Home Values in the Area
Average Home Value in this Area
Purchase History
| Date | Buyer | Sale Price | Title Company |
|---|---|---|---|
| Rios Eric P | -- | Wfg Title Insurance Company | |
| Chun Il Jong | -- | First American Title Ins Co | |
| Rios Eric | $162,000 | First American Title Ins Co |
Source: Public Records
Mortgage History
| Date | Status | Borrower | Loan Amount |
|---|---|---|---|
| Open | Rios Eric P | $287,500 | |
| Closed | Rios Eric | $155,790 |
Source: Public Records
Tax History
| Year | Tax Paid | Tax Assessment Tax Assessment Total Assessment is a certain percentage of the fair market value that is determined by local assessors to be the total taxable value of land and additions on the property. | Land | Improvement |
|---|---|---|---|---|
| 2025 | $3,753 | $316,906 | $184,959 | $131,947 |
| 2024 | $3,753 | $310,693 | $181,333 | $129,360 |
| 2023 | $3,658 | $304,601 | $177,777 | $126,824 |
| 2022 | $3,609 | $298,629 | $174,291 | $124,338 |
| 2021 | $3,557 | $292,774 | $170,874 | $121,900 |
| 2020 | $3,535 | $289,772 | $169,121 | $120,651 |
| 2019 | $3,448 | $284,091 | $165,805 | $118,286 |
| 2018 | $3,385 | $278,521 | $162,554 | $115,967 |
| 2017 | $3,280 | $273,060 | $159,366 | $113,694 |
| 2016 | $3,218 | $267,706 | $156,241 | $111,465 |
| 2015 | $3,180 | $263,685 | $153,894 | $109,791 |
| 2014 | $3,023 | $258,520 | $150,879 | $107,641 |
Source: Public Records
Map
Nearby Homes
- 8219 Joshua Cir
- 2780 W Stanley Place
- 2870 W Monroe Ave
- 2758 W Stockton Ave
- 330 N Colgate St
- 8572 Corsica Ln
- 8224 Guava Ave
- 101 Laxore St Unit 205
- 2770 W Lincoln Ave Unit 58
- 2770 W Lincoln Ave Unit 55
- 101 S Laxore St Unit 203
- 200 N Grand Ave Unit 57
- 7720 Crescent Ave
- 243 N Magnolia Ave Unit 5
- 231 S Laxore St
- 2942 W Floyd Ave
- 315 S Benwood Dr
- 211 S Beach Blvd Unit 92
- 211 S Beach Blvd Unit 42
- 211 S Beach Blvd Unit 119
- 8550 Cedar Dr
- 8574 Cedar Dr
- 8540 Cedar Dr
- 8586 Cedar Dr
- 8561 Kendor Dr
- 8561 Cedar Dr
- 8581 Cedar Dr
- 8532 Cedar Dr
- 8541 Kendor Dr
- 8571 Kendor Dr
- 8598 Cedar Dr
- 8541 Cedar Dr
- 8602 Cherry Cir
- 8595 Cedar Dr
- 8352 Crescent Ave
- 8607 Cedar Dr
- 8300 Crescent Ave
- 8324 Crescent Ave
- 8562 Bel Air St
- 8572 Bel Air St
Your Personal Tour Guide
Ask me questions while you tour the home.