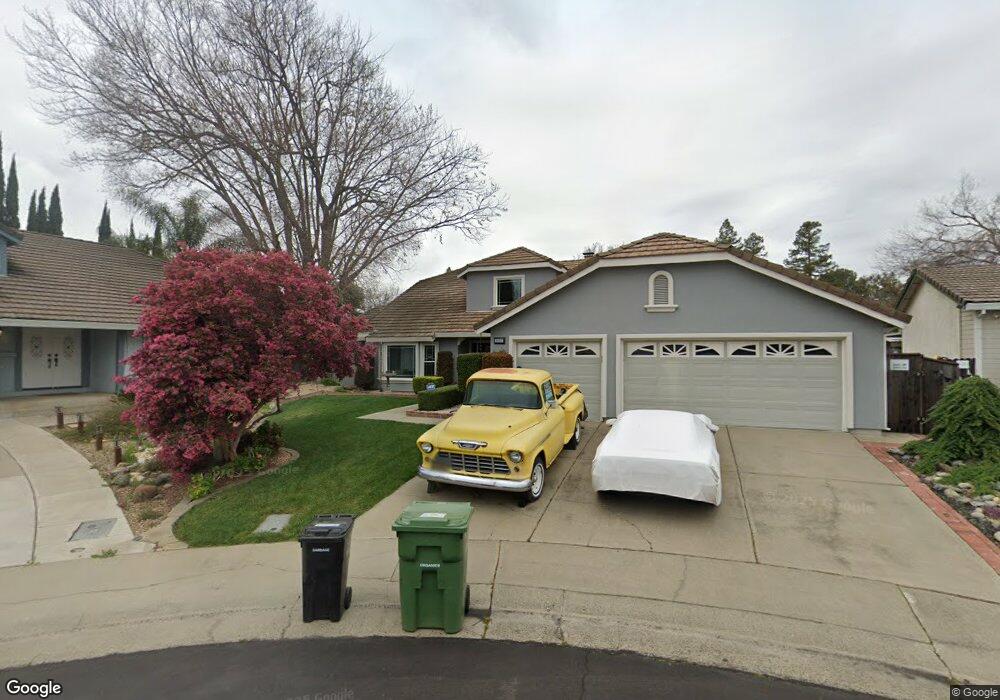
8565 Pearl Crest Ct Elk Grove, CA 95624
North East Elk Grove NeighborhoodEstimated Value: $495,000 - $721,856
3
Beds
4
Baths
2,814
Sq Ft
$221/Sq Ft
Est. Value
About This Home
This home is located at 8565 Pearl Crest Ct, Elk Grove, CA 95624 and is currently estimated at $622,964, approximately $221 per square foot. 8565 Pearl Crest Ct is a home located in Sacramento County with nearby schools including Ellen Feickert Elementary School, Joseph Kerr Middle School, and Elk Grove High School.
Ownership History
Date
Name
Owned For
Owner Type
Purchase Details
Closed on
Aug 26, 2004
Sold by
Cancino Donna M
Bought by
Cancino Rafael P and Cancino Donna M
Current Estimated Value
Purchase Details
Closed on
Dec 12, 2003
Sold by
Cancino Donna M and Whitlow Donna M
Bought by
Cancino Donna M
Home Financials for this Owner
Home Financials are based on the most recent Mortgage that was taken out on this home.
Original Mortgage
$105,500
Interest Rate
6.03%
Mortgage Type
Purchase Money Mortgage
Purchase Details
Closed on
Mar 27, 1997
Sold by
Sue Anderson David J and Sue Carol
Bought by
Whitlow Donna M
Home Financials for this Owner
Home Financials are based on the most recent Mortgage that was taken out on this home.
Original Mortgage
$121,000
Interest Rate
7.56%
Purchase Details
Closed on
Mar 13, 1997
Sold by
Va
Bought by
Anderson David J and Anderson Carol Sue
Home Financials for this Owner
Home Financials are based on the most recent Mortgage that was taken out on this home.
Original Mortgage
$121,000
Interest Rate
7.56%
Create a Home Valuation Report for This Property
The Home Valuation Report is an in-depth analysis detailing your home's value as well as a comparison with similar homes in the area
Home Values in the Area
Average Home Value in this Area
Purchase History
| Date | Buyer | Sale Price | Title Company |
|---|---|---|---|
| Cancino Rafael P | -- | -- | |
| Cancino Donna M | -- | Sierra Valley Title Company | |
| Cancino Donna M | -- | Sierra Valley Title Company | |
| Whitlow Donna M | $186,000 | Old Republic Title Company | |
| Anderson David J | -- | -- |
Source: Public Records
Mortgage History
| Date | Status | Borrower | Loan Amount |
|---|---|---|---|
| Closed | Cancino Donna M | $105,500 | |
| Closed | Whitlow Donna M | $121,000 |
Source: Public Records
Tax History Compared to Growth
Tax History
| Year | Tax Paid | Tax Assessment Tax Assessment Total Assessment is a certain percentage of the fair market value that is determined by local assessors to be the total taxable value of land and additions on the property. | Land | Improvement |
|---|---|---|---|---|
| 2025 | $3,878 | $363,200 | $71,648 | $291,552 |
| 2024 | $3,878 | $356,080 | $70,244 | $285,836 |
| 2023 | $3,776 | $349,099 | $68,867 | $280,232 |
| 2022 | $3,704 | $342,255 | $67,517 | $274,738 |
| 2021 | $3,654 | $335,545 | $66,194 | $269,351 |
| 2020 | $3,603 | $332,106 | $65,516 | $266,590 |
| 2019 | $3,533 | $325,595 | $64,232 | $261,363 |
| 2018 | $3,434 | $319,212 | $62,973 | $256,239 |
| 2017 | $3,371 | $312,954 | $61,739 | $251,215 |
| 2016 | $3,196 | $306,819 | $60,529 | $246,290 |
| 2015 | $3,134 | $302,211 | $59,620 | $242,591 |
| 2014 | $3,080 | $296,292 | $58,453 | $237,839 |
Source: Public Records
Map
Nearby Homes
- 8737 El Toreador Way
- 9455 E Stockton Blvd
- 8865 Halverson Dr
- 8392 Red Fox Way
- 8804 On Ct
- 8966 Ivanpah Ct
- 8841 Freemark Way
- 9333 Aizenberg Cir
- 9407 Aizenberg Cir
- 8770 Superb Cir
- 8904 Hyperia Ct
- 8896 Kelsey Dr
- 9011 Quail Cove Dr
- 8288 Primoak Way
- 8360 Blackman Way
- 9040 Elk Grove Florin Rd
- 9497 Sara St
- 9146 Quail Brook Cir
- 8551 Patrickswell Ct
- 8930 2nd Ave
- 8561 Pearl Crest Ct
- 8569 Pearl Crest Ct
- 8572 Fern Crest Way
- 8568 Fern Crest Way
- 8576 Fern Crest Way
- 8565 Garland Crest Ct
- 8573 Pearl Crest Ct
- 8564 Fern Crest Way
- 8560 Pearl Crest Ct
- 8580 Fern Crest Way
- 8561 Garland Crest Ct
- 8564 Garland Crest Ct
- 8564 Pearl Crest Ct
- 8568 Pearl Crest Ct
- 8560 Fern Crest Way
- 9209 Opal Crest Ct
- 8572 Pearl Crest Ct
- 9208 Emerald Crest Dr
- 9208 Opal Crest Ct
- 8560 Garland Crest Ct