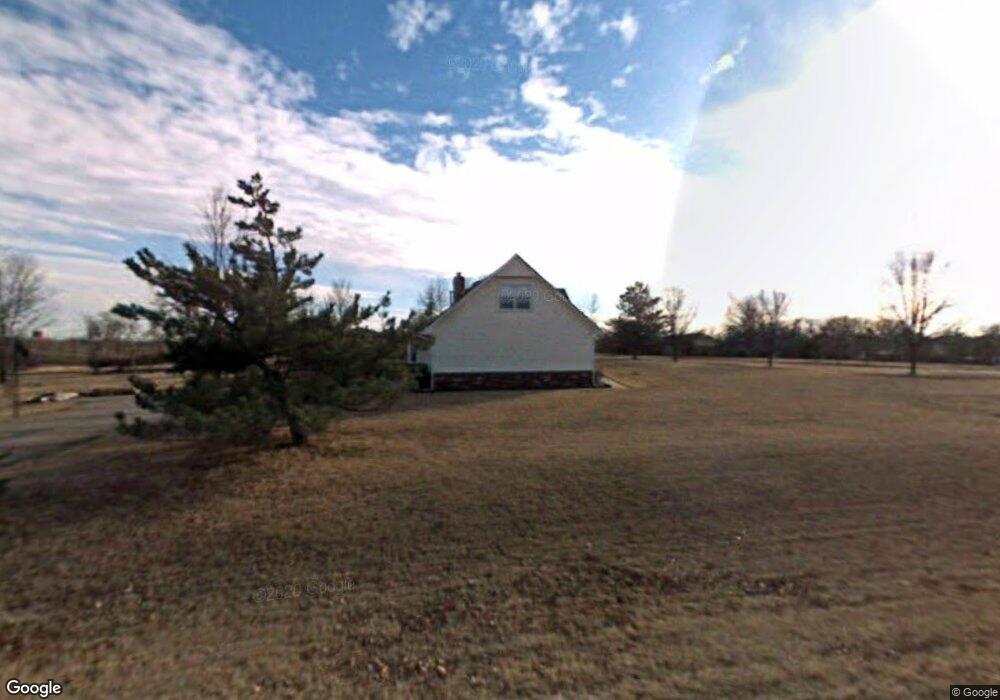
8566 E Wesson Ct Claremore, OK 74019
Estimated Value: $342,974 - $387,000
4
Beds
3
Baths
2,544
Sq Ft
$142/Sq Ft
Est. Value
About This Home
This home is located at 8566 E Wesson Ct, Claremore, OK 74019 and is currently estimated at $362,244, approximately $142 per square foot. 8566 E Wesson Ct is a home located in Rogers County with nearby schools including Catalayah Elementary School, Will Rogers Junior High School, and Claremore High School.
Ownership History
Date
Name
Owned For
Owner Type
Purchase Details
Closed on
Jul 19, 2022
Sold by
Herriman Larry W
Bought by
Herriman Larry W and Herriman Melissa
Current Estimated Value
Home Financials for this Owner
Home Financials are based on the most recent Mortgage that was taken out on this home.
Original Mortgage
$117,100
Outstanding Balance
$97,972
Interest Rate
4.92%
Mortgage Type
Balloon
Estimated Equity
$264,272
Purchase Details
Closed on
Oct 31, 2005
Sold by
Pearce Daniel B and Pearce Charity M
Bought by
Herriman Larry W
Home Financials for this Owner
Home Financials are based on the most recent Mortgage that was taken out on this home.
Original Mortgage
$27,525
Interest Rate
5.75%
Mortgage Type
Purchase Money Mortgage
Purchase Details
Closed on
Sep 28, 2001
Sold by
Sunday Sally K
Create a Home Valuation Report for This Property
The Home Valuation Report is an in-depth analysis detailing your home's value as well as a comparison with similar homes in the area
Purchase History
| Date | Buyer | Sale Price | Title Company |
|---|---|---|---|
| Herriman Larry W | -- | New Title Company Name | |
| Herriman Larry W | $183,500 | Century Title Lc | |
| -- | $164,500 | -- |
Source: Public Records
Mortgage History
| Date | Status | Borrower | Loan Amount |
|---|---|---|---|
| Open | Herriman Larry W | $117,100 | |
| Previous Owner | Herriman Larry W | $27,525 |
Source: Public Records
Tax History
| Year | Tax Paid | Tax Assessment Tax Assessment Total Assessment is a certain percentage of the fair market value that is determined by local assessors to be the total taxable value of land and additions on the property. | Land | Improvement |
|---|---|---|---|---|
| 2025 | $2,376 | $26,707 | $4,299 | $22,408 |
| 2024 | $2,304 | $25,930 | $3,866 | $22,064 |
| 2023 | $2,304 | $25,174 | $3,300 | $21,874 |
| 2022 | $2,216 | $24,939 | $3,300 | $21,639 |
| 2021 | $2,050 | $24,213 | $3,300 | $20,913 |
| 2020 | $2,065 | $23,829 | $3,300 | $20,529 |
| 2019 | $2,026 | $22,869 | $3,300 | $19,569 |
| 2018 | $2,077 | $23,835 | $3,300 | $20,535 |
| 2017 | $1,999 | $22,791 | $3,300 | $19,491 |
| 2016 | $1,980 | $22,127 | $3,300 | $18,827 |
| 2015 | $1,899 | $21,483 | $3,300 | $18,183 |
| 2014 | $1,841 | $20,857 | $3,300 | $17,557 |
Source: Public Records
Map
Nearby Homes
- 20936 Valley West Dr
- 22095 Riverwood Dr
- 21864 Westin Park Ln
- 9212 E Shiloh Rd
- 21078 S Hariston St
- 22365 Riverwood Dr
- 20807 River Bend Dr
- 9376 Colonial Dr
- 2925 W Holly Hwy 20 Rd
- 2927 Holly Rd
- 2925 Holly Rd
- 23023 S 4120 Rd
- 3103 Callaway Dr
- 3311 Heritage Dr
- 506 Castle Pines Cir
- 1202 Fairway St
- 1204 Fairway St
- 3104 Harbour Town Place
- 3421 Heritage Dr
- 3204 Heritage Dr
- 4710 Wesson Ave
- 21455 S Wesson Ave
- 4817 E Wesson Ct
- 4702 E Wesson Ct
- 401 SW Wesson Ave
- 401 Wesson Ave
- null S Wesson Ave
- 8455 E Remington Ave
- 21355 S Wesson Ave
- 21474 S Wesson Ave
- 8555 E Wesson Ct
- 21467 S Wesson Ave
- 21323 S Wesson Ave
- 8585 E Wesson Ct
- 8422 E Remington Ave
- 7901 E Boysen Dr
- 21525 S Wesson Ave
- 8403 E Remington Ave
- 8388 E Browning Ave
- 8344 E Remington Ave
Your Personal Tour Guide
Ask me questions while you tour the home.