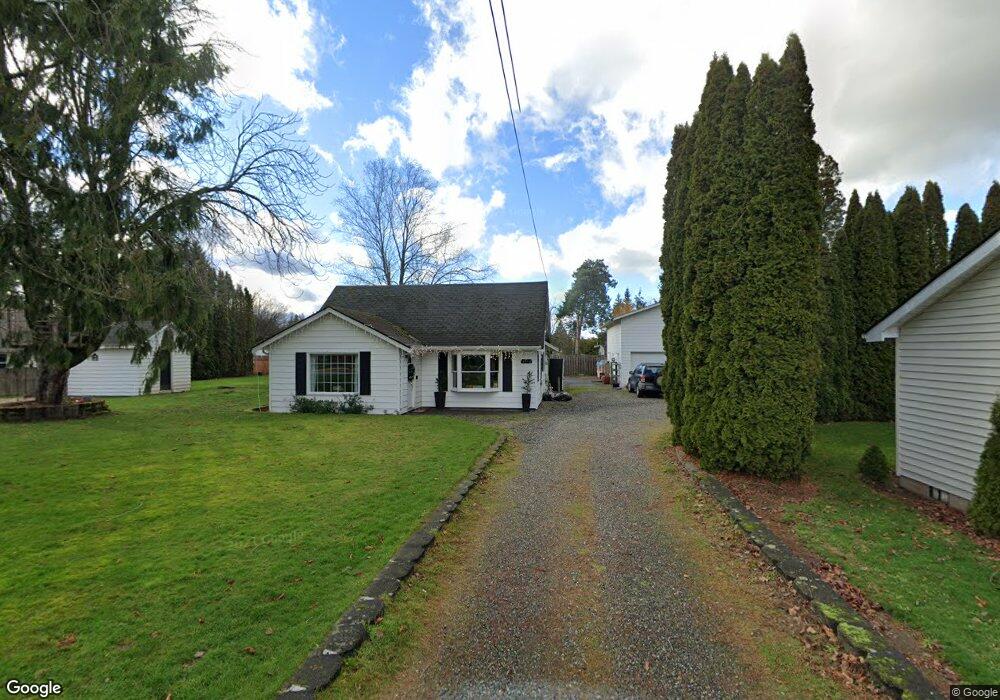
8567 Vinup Rd Lynden, WA 98264
Estimated Value: $538,000 - $596,000
4
Beds
2
Baths
1,887
Sq Ft
$300/Sq Ft
Est. Value
About This Home
This home is located at 8567 Vinup Rd, Lynden, WA 98264 and is currently estimated at $565,240, approximately $299 per square foot. 8567 Vinup Rd is a home located in Whatcom County with nearby schools including Lynden High School, Lynden Christian Schools: Administration, and Lynden Christian School.
Ownership History
Date
Name
Owned For
Owner Type
Purchase Details
Closed on
Aug 2, 2011
Sold by
Oconnor Larry and Oconnor Christina D
Bought by
Tabayoyon Alexander E and Tabayoyon Katie A
Current Estimated Value
Home Financials for this Owner
Home Financials are based on the most recent Mortgage that was taken out on this home.
Original Mortgage
$249,000
Outstanding Balance
$171,518
Interest Rate
4.46%
Mortgage Type
VA
Estimated Equity
$393,722
Purchase Details
Closed on
Jul 3, 2000
Sold by
Grapensteter Thomas E and Grapensteter Rene F
Bought by
Oconnor Larry and Oconnor Christina D
Home Financials for this Owner
Home Financials are based on the most recent Mortgage that was taken out on this home.
Original Mortgage
$115,000
Interest Rate
8.55%
Create a Home Valuation Report for This Property
The Home Valuation Report is an in-depth analysis detailing your home's value as well as a comparison with similar homes in the area
Home Values in the Area
Average Home Value in this Area
Purchase History
| Date | Buyer | Sale Price | Title Company |
|---|---|---|---|
| Tabayoyon Alexander E | $249,280 | Stewart Title Company | |
| Oconnor Larry | $155,000 | Chicago Title Insurance |
Source: Public Records
Mortgage History
| Date | Status | Borrower | Loan Amount |
|---|---|---|---|
| Open | Tabayoyon Alexander E | $249,000 | |
| Previous Owner | Oconnor Larry | $115,000 | |
| Closed | Oconnor Larry | $2,000 |
Source: Public Records
Tax History Compared to Growth
Tax History
| Year | Tax Paid | Tax Assessment Tax Assessment Total Assessment is a certain percentage of the fair market value that is determined by local assessors to be the total taxable value of land and additions on the property. | Land | Improvement |
|---|---|---|---|---|
| 2024 | $3,800 | $529,827 | $272,813 | $257,014 |
| 2023 | $3,800 | $528,379 | $281,250 | $247,129 |
| 2022 | $3,148 | $412,890 | $153,434 | $259,456 |
| 2021 | $3,088 | $341,227 | $126,803 | $214,424 |
| 2020 | $2,706 | $304,675 | $113,220 | $191,455 |
| 2019 | $2,407 | $279,455 | $103,955 | $175,500 |
| 2018 | $2,631 | $254,834 | $94,699 | $160,135 |
| 2017 | $2,416 | $228,735 | $85,000 | $143,735 |
| 2016 | $2,286 | $223,373 | $82,500 | $140,873 |
| 2015 | $2,026 | $210,174 | $79,350 | $130,824 |
| 2014 | -- | $203,050 | $76,650 | $126,400 |
| 2013 | -- | $201,400 | $75,000 | $126,400 |
Source: Public Records
Map
Nearby Homes
- 1178 E Grover St Unit 101
- 1251 Garden Cir
- 1136 N Cascade Ct
- 1319 Bradley Ct
- 1095 Terrace Dr
- 1660 Eastwood Way
- 1402 Bradley Meadows Ln
- 924 E Grover St
- 8639 Bender Rd
- 9586 Bender Rd
- 1792 Bradley Rd
- 1077 Hampton Rd
- 137 E Cedar Dr
- 400 E Front St
- 107 Springview Dr
- 2201 Dejong Dr
- 2205 Dejong Dr
- 1725 Aaron Dr
- 114 Twin Sister Loop
- 2202 Berryman Loop